Update : AgriLife Extension TCWP GIFT program has finished sampling more water quality samples from Exploration Green. Sampling ran from April of 2023 through February of 2024. We added new sites to the existing outfall location at Exploration Green to collect samples from Phases 1, 3 and 4 outfall locations. All sampling data and documentation should be fully compiled soon. Look out for more updates!
| Phase 1 | Phase 3 | Phase 4 | ||||||||||||
| Date | TSS (mg/L) | E. Coli (mpn/100mL) | Phosphorous (mg/L) | Ammonia-N (mg/L) | TSS (mg/L) | E. Coli (mpn/100mL) | Phosphorous (mg/L) | Ammonia-N (mg/L) | TSS (mg/L) | E.Coli (mpn/100mL) | Phosphorous (mg/L) | Ammonia-N (mg/L) | ||
| 4/11/23 | 15.3 | 313 | 0.0665 | <0.1 | <4.0 | N/A | <0.0600 | <0.1 | 68.2 | N/A | <0.0600 | <0.1 | ||
| 4/27/23 | 18.8 | 1410 | N/A | 0.1 | 3 | 73 | 0.0947 | <0.1 | 25.7 | 3260 | 0.108 | N/A | ||
| 5/11/23 | 17.1 | 1020 | 0.172 | 0.2 | 3 | <10 | <0.0600 | <0.1 | 36.4 | 1410 | <0.0600 | <0.1 | ||
| 5/25/23 | 14.5 | 359 | 0.155 | 0.1 | 24.5 | 41 | <0.0600 | 0.2 | 42 | 228 | <0.0600 | <0.1 | ||
| 6/8/23 | 22.6 | 1120 | 0.11 | <0.1 | 67.1 | 96 | <0.0600 | <0.1 | 36.7 | 1050 | <0.0600 | <0.1 | ||
| 6/22/23 | 7.6 | 383 | 0.183 | 0.2 | 7.2 | 689 | <0.0600 | <0.1 | 40 | 301 | <0.0600 | <0.1 | ||
| 7/6/23 | 54.5 | 384 | 0.255 | 0.2 | N/A | N/A | N/A | N/A | 58.6 | 620 | <0.0600 | <0.1 | ||
| 7/20/23 | 13.8 | 1020 | 0.349 | 0.4 | N/A | N/A | N/A | N/A | 30.9 | 318 | <0.0600 | <0.1 | ||
| 8/3/23 | 18.5 | 317 | 0.467 | 0.1 | N/A | N/A | N/A | N/A | 21.2 | 1050 | 0.0782 | 0.1 | ||
| 8/17/23 | 77.5 | 3260 | 0.316 | <0.1 | 7.6 | 3260 | 0.0766 | <0.1 | 37.5 | 8160 | <0.0600 | <0.1 | ||
| 8/30/23 | 38.9 | 201 | 0.361 | <0.1 | 5.2 | 41 | 0.182 | <0.1 | 45 | 241 | 0.242 | <0.1 | ||
| 9/13/23 | 31 | 1330 | 0.257 | <0.1 | 4.4 | <10 | 0.241 | <0.1 | 36.3 | 373 | 0.12 | <0.1 | ||
| 9/27/23 | 14.1 | 305 | 0.296 | <0.1 | 2.2 | 145 | 0.276 | <0.1 | 21.8 | 292 | 0.0814 | <0.1 | ||
| 10/11/23 | 19 | 480 | 0.301 | 0.1 | 2.7 | 480 | 0.32 | <0.1 | 34.5 | 281 | <0.0600 | <0.1 | ||
| 10/25/23 | 21.4 | 728 | 0.388 | <0.1 | 9.6 | 2850 | 0.259 | <0.1 | 25.2 | 1660 | 0.0632 | <0.1 | ||
| 11/8/23 | 17 | 1120 | 0.298 | <0.1 | 6.4 | 5790 | 0.496 | <0.1 | 57.8 | 2990 | 0.067 | 0.1 | ||
| 11/29/23 | 24.1 | 404 | 0.15 | <0.1 | 12.8 | 31 | 0.161 | 3 | 34.4 | 1050 | <0.0600 | <0.1 | ||
| 12/13/23 | 36.7 | 172 | 0.668 | 0.1 | 4.3 | 150 | 0.165 | 0.1 | 13.7 | 476 | <0.0600 | <0.1 | ||
| 1/3/24 | 33.6 | 13000 | 0.286 | 0.1 | 5 | 1050 | 0.200 | <0.1 | 31.5 | 13000 | 0.0624 | <0.1 | ||
| 1/18/24 | 14.8 | 86 | 0.364 | 0.5 | <1.0 | 110 | 0.136 | <0.1 | 16.2 | 295 | 0.17 | 0.1 | ||
| 1/31/24 | 8.8 | N/A | 0.501 | 0.6 | 1.8 | 85 | 0.139 | <0.1 | 18.4 | 379 | 0.264 | 0.6 | ||
| 2/14/24 | 28.8 | 231 | 0.522 | 0.9 | 1.1 | 52 | 0.186 | <0.1 | 26.2 | 285 | 0.269 | 1.4 | ||
| 2/28/24 | 55.9 | 91 | 0.470 | 0.5 | 3.3 | 222 | 0.397 | <0.1 | 51.5 | 47 | 0.174 | <0.1 | ||
Exploration Green Sampler Site 1
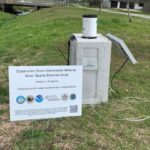
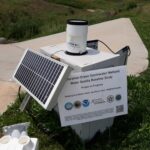
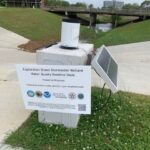
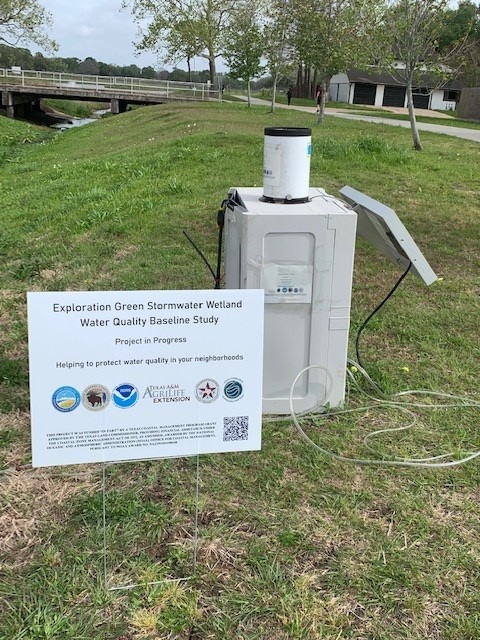
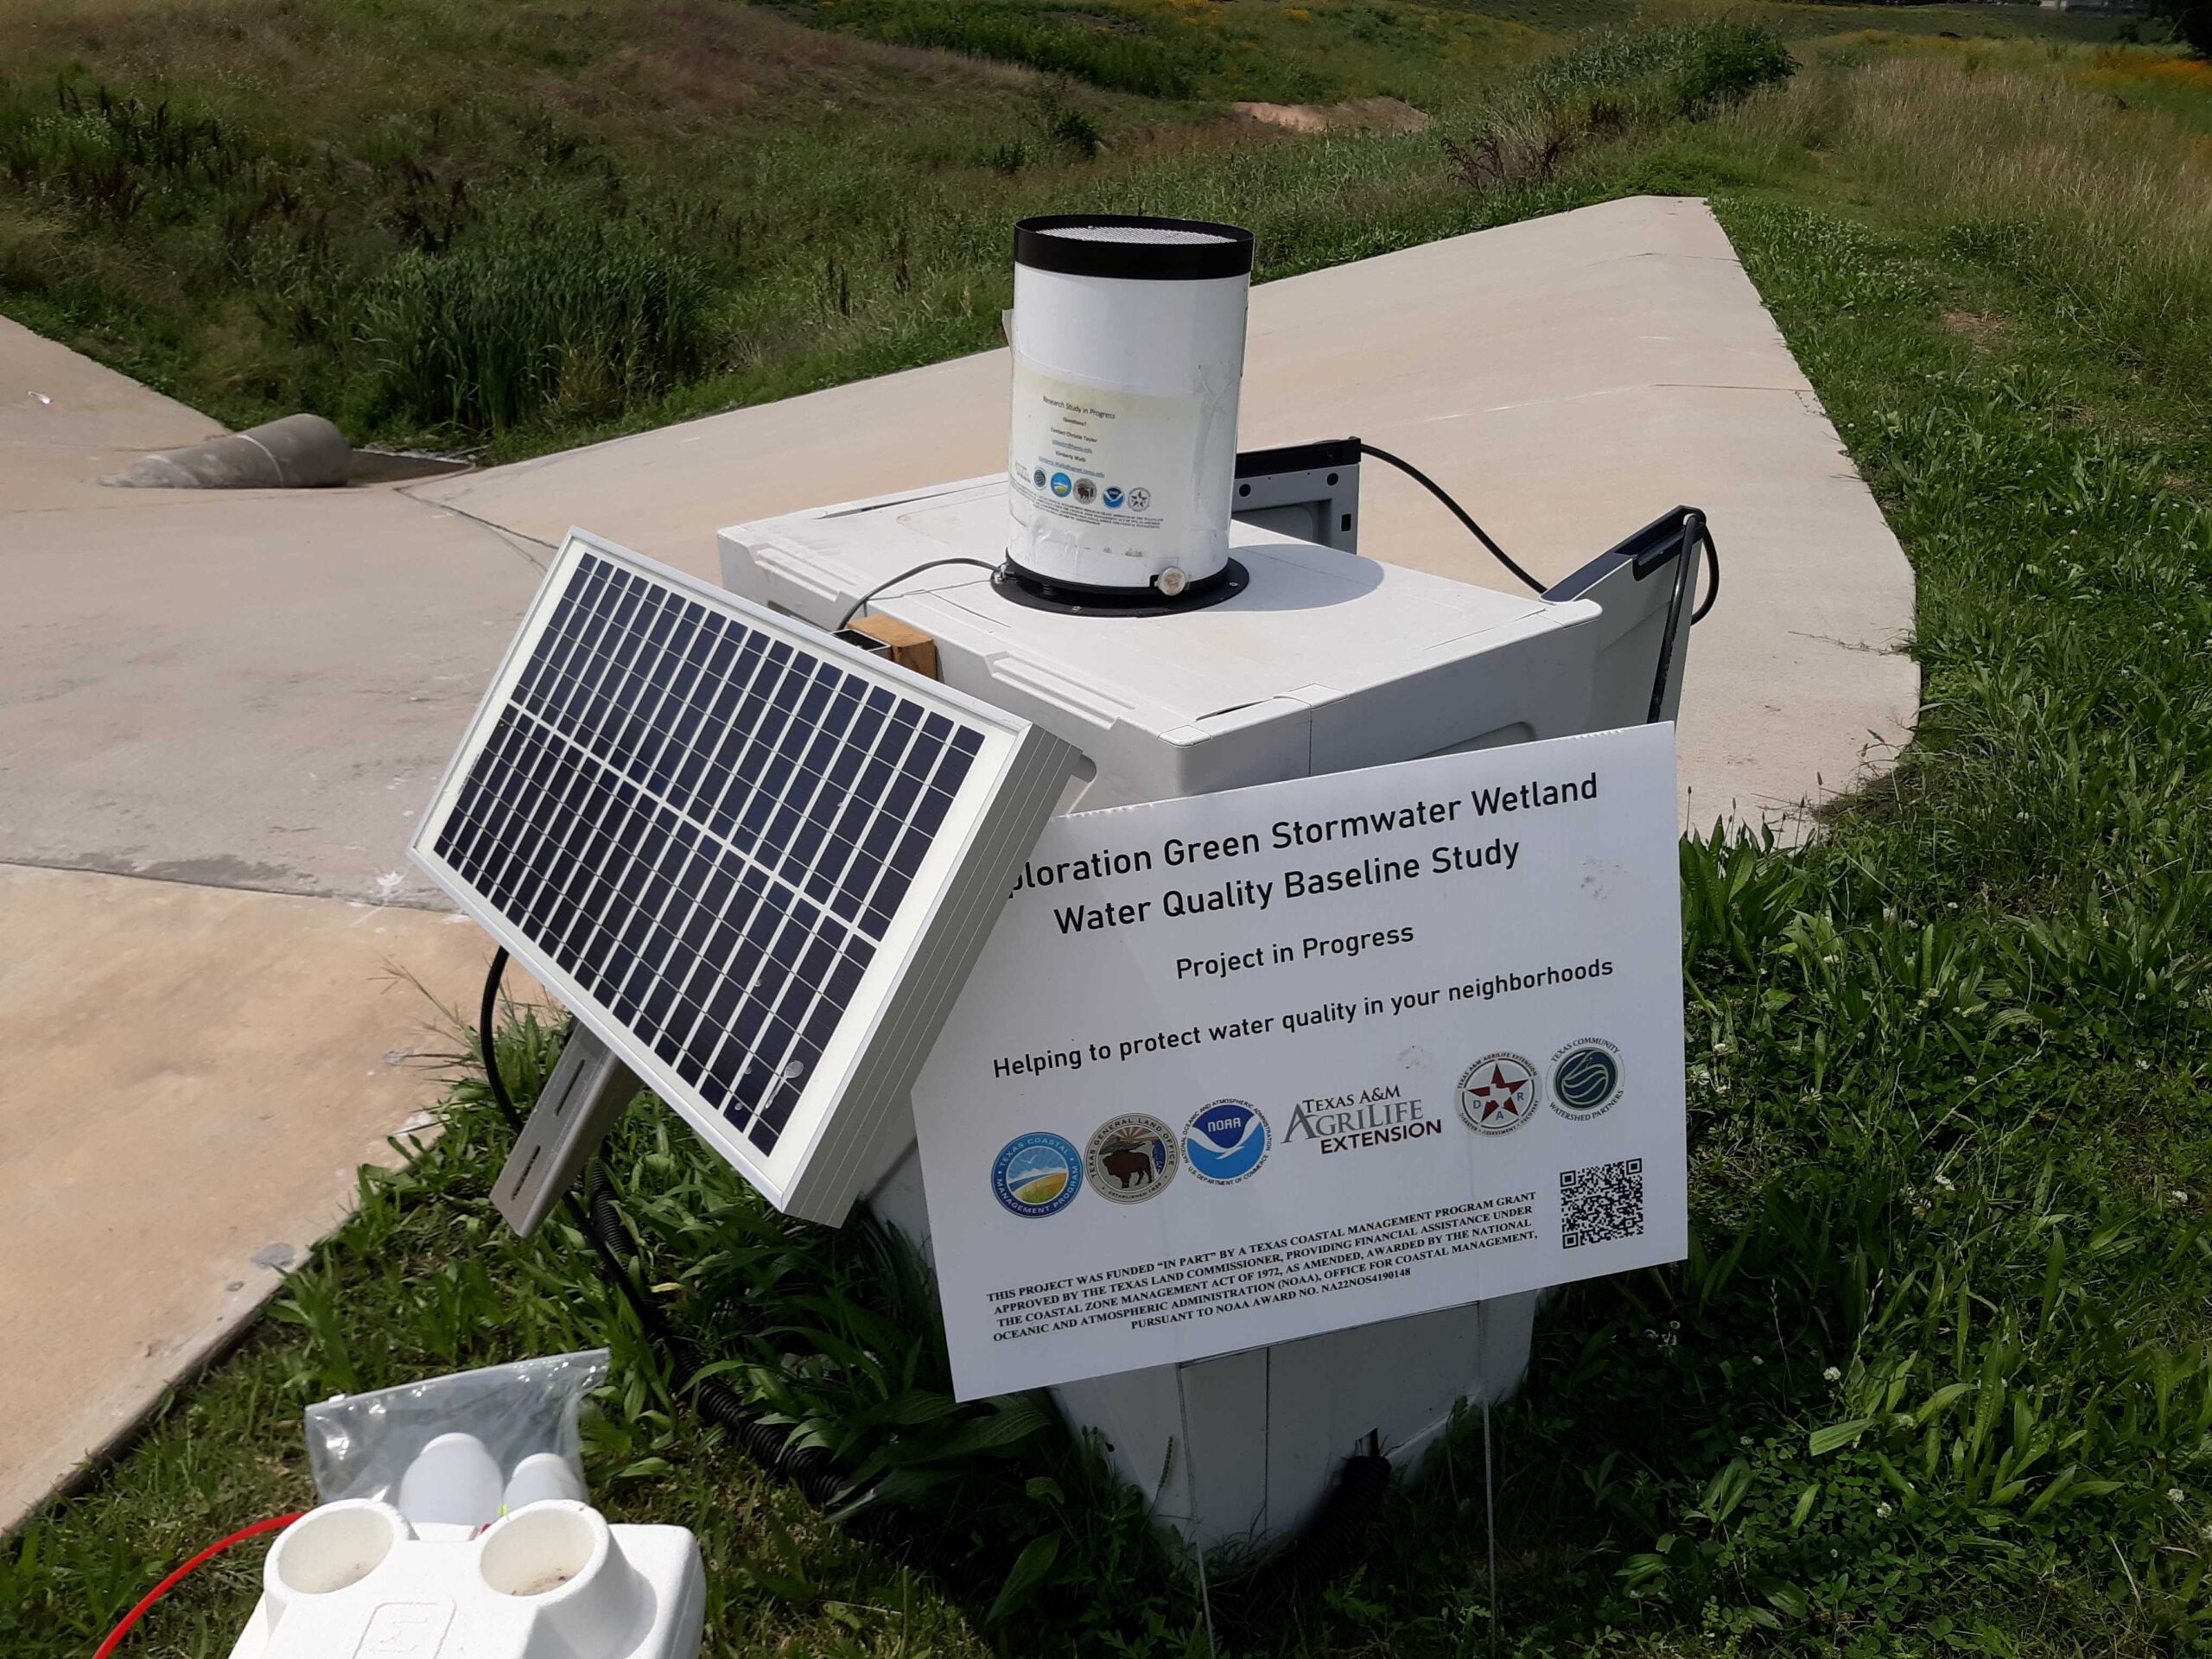
Location #1: Exploration Green Conservation and Recreation Area , Phase 1 in the 1800 block of Reseda Dr. Houston TX, 77058. Sampling began on April 4th, 2023.
Site Data
Lab Report 4/11/23 | Lab report 4/27/23 | Lab report 5/11/23 | Lab report 5/25/23 | Lab report 6/8/23 | Lab report 6/22/23 | Lab report 7/6/23 | Lab report 7/20/23 | Lab report 8/3/23 | Lab report 8/17/23 | Lab report 8/30/23 | Lab report 9/13/23 | Lab report 9/27/23 | Lab report 10/11/23 | Lab report 10/25/23 | Lab report 11/8/23 | Lab report 11/29/23 | Lab report 12/13/23 | Lab report 1/3/24 | Lab report 1/18/24 | Lab report 1/31/24 | Lab report 2/14/24 | Lab report 2/28/24
ISCO Flowlink Data
Rainfall
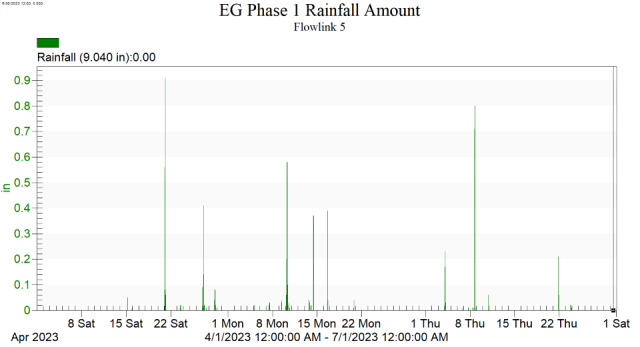
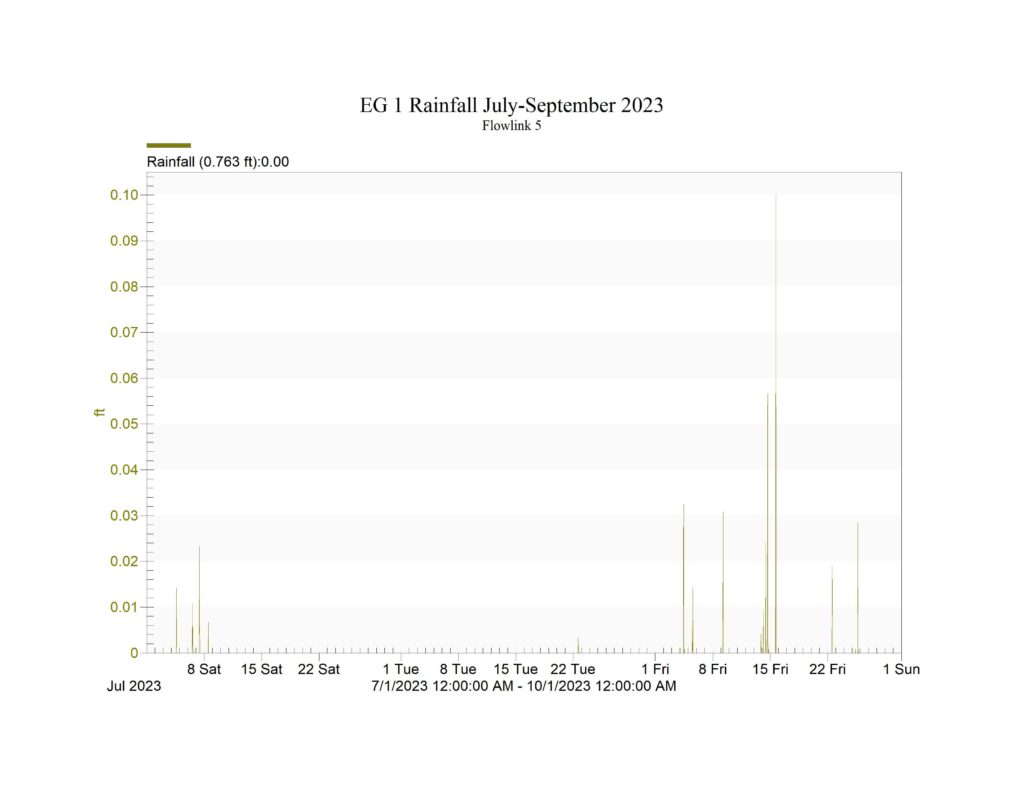
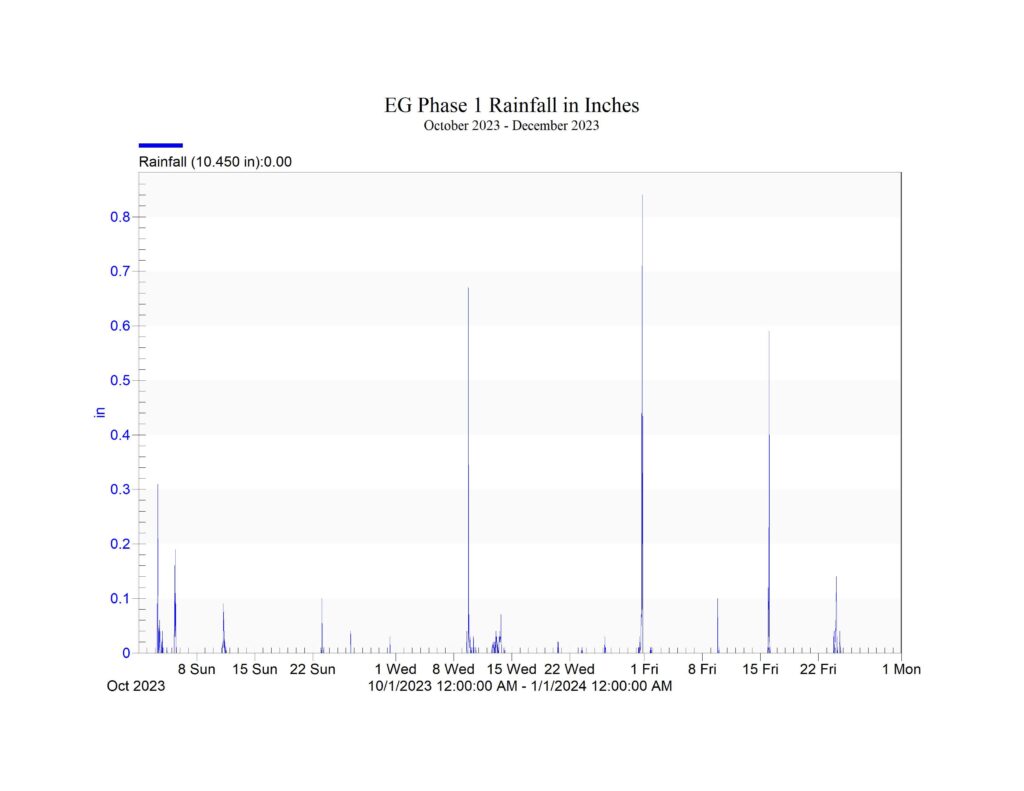
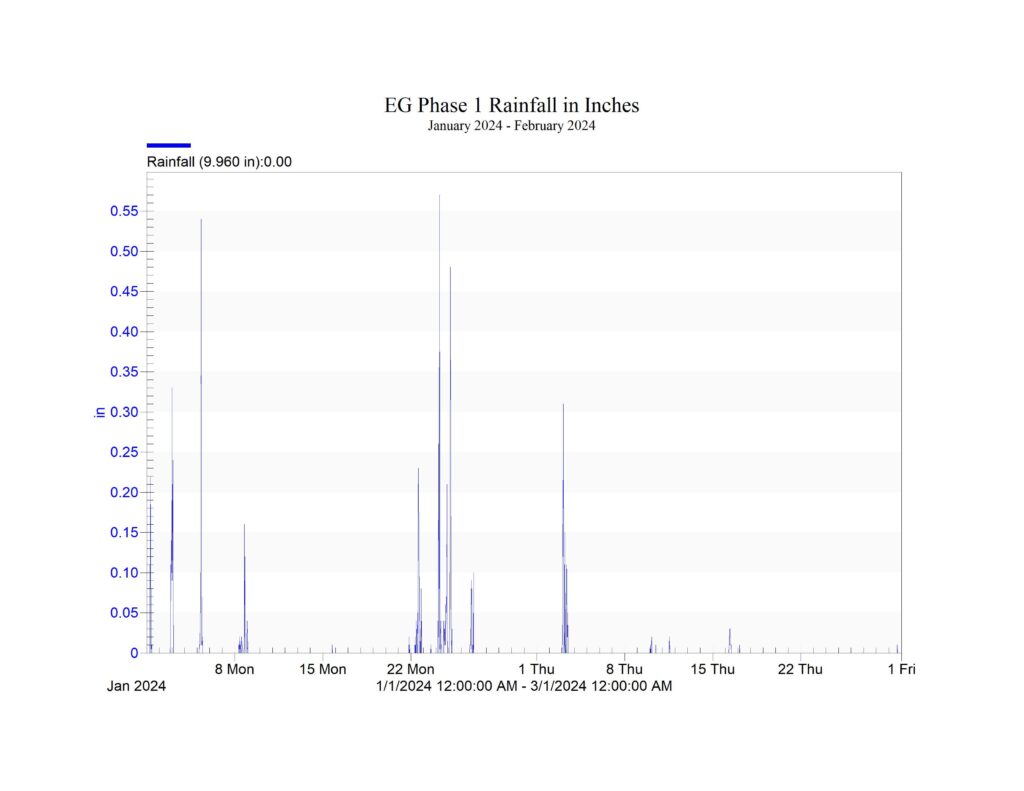
EG1-Rainfall April-June23 | EG 1 Rainfall July -September 2023 | EG 1 Rainfall Oct-DEc. 2023 Table | EG 1 Rainfall Jan -Feb 2024 Table
Flow
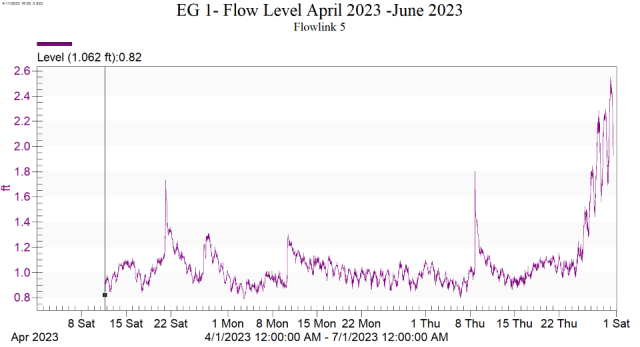
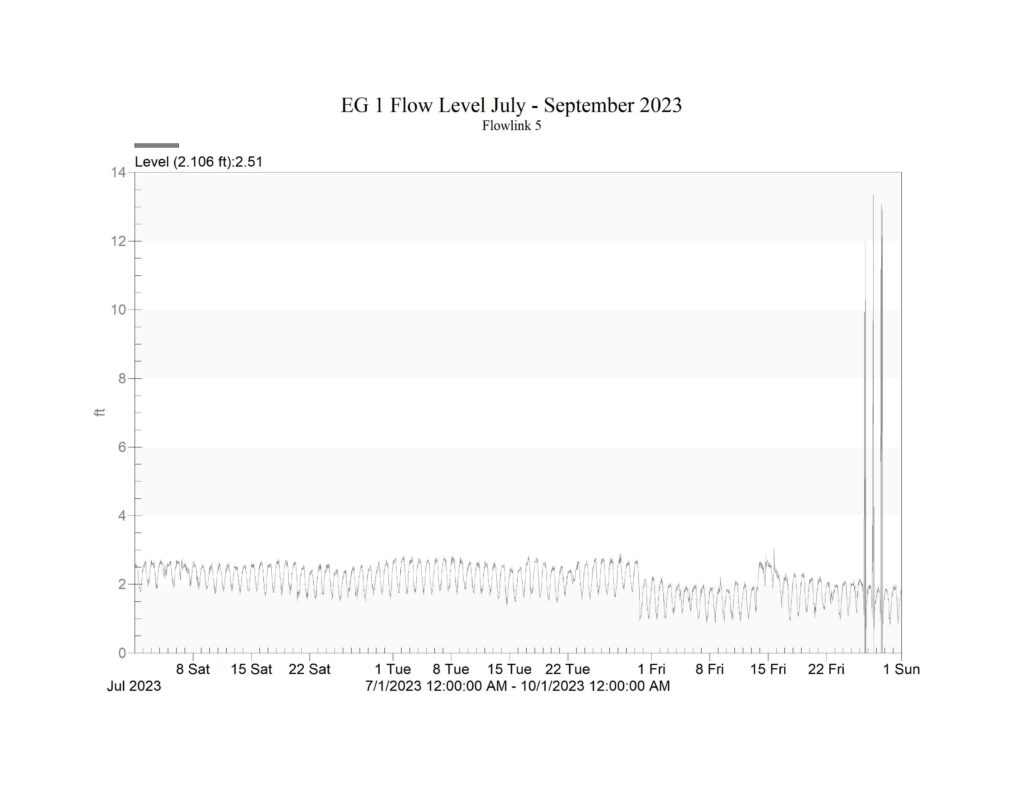
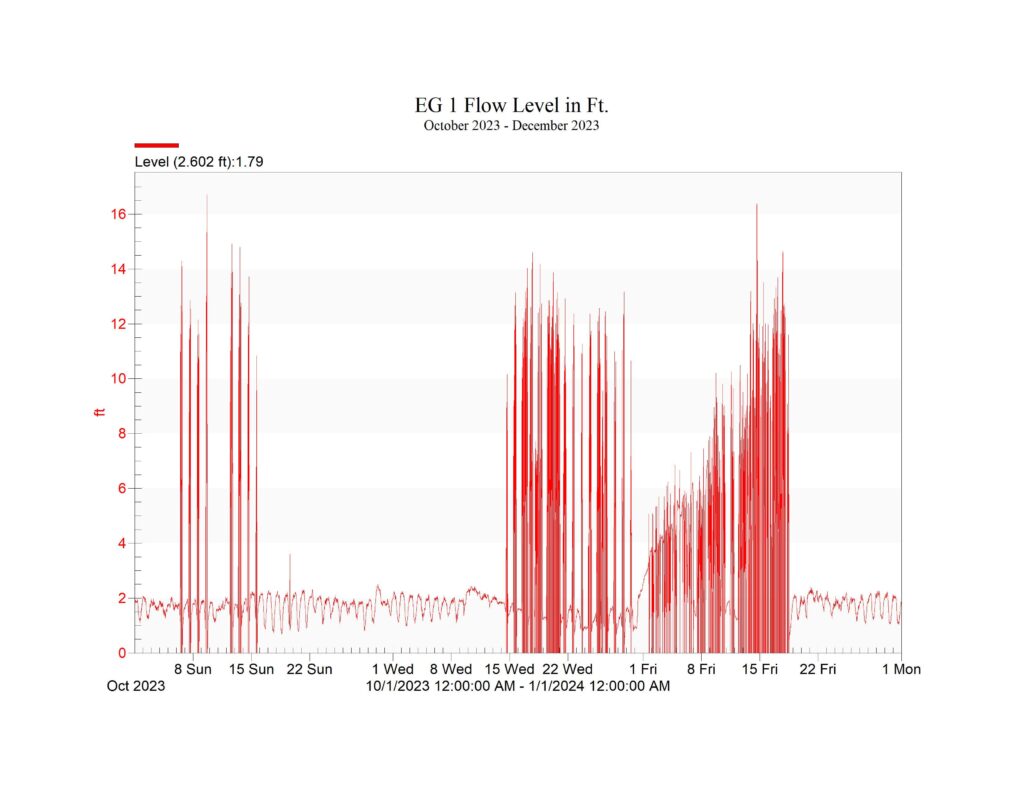
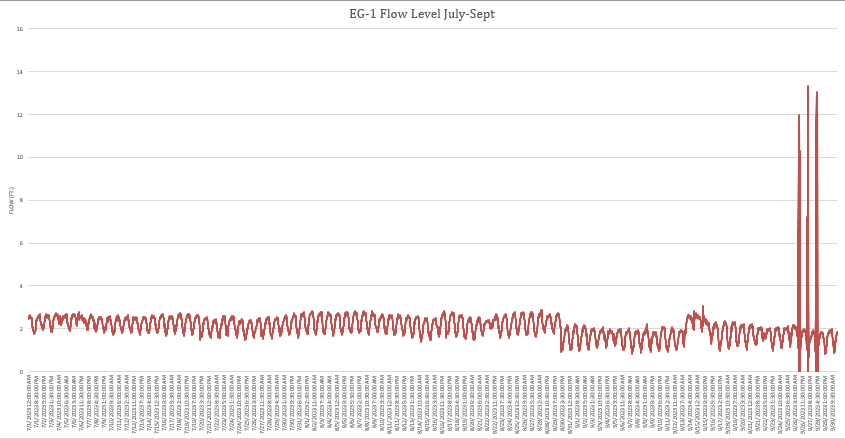
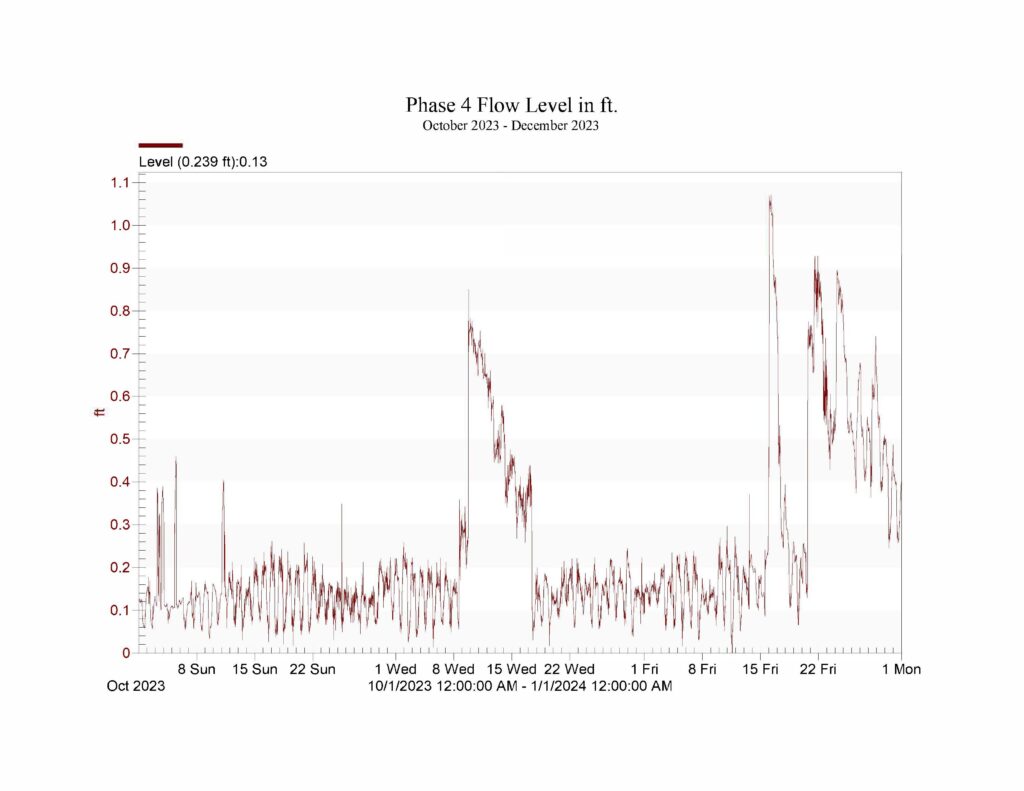
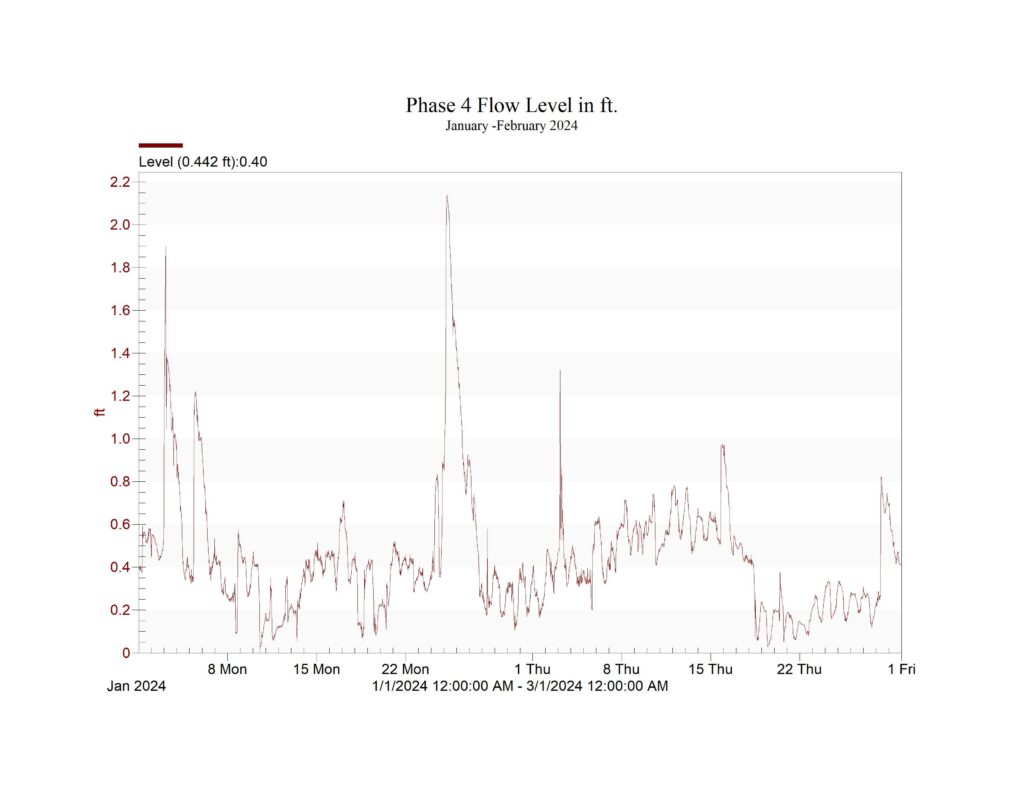
EG 1 Flow Level July- September 2023 | EG 1 Flow Level Jan. -Feb 2024 Table
Check back for updates…
Exploration Green Site 3
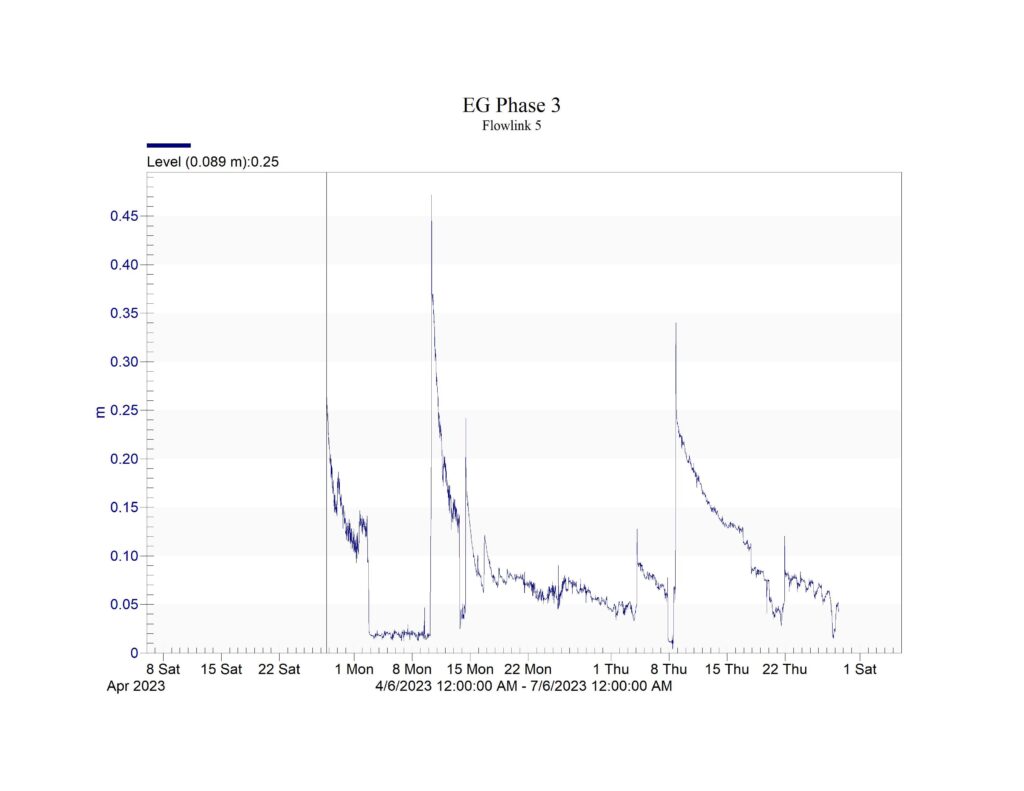
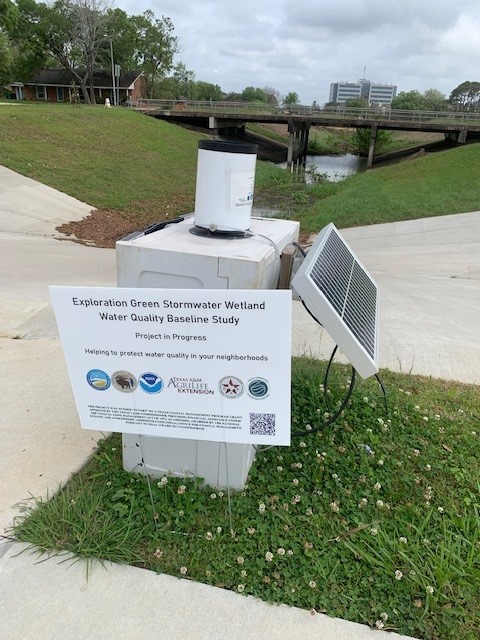
Location #2: the outfall in Phase 3 of Exploration Green located between El Dorado Blvd. and Space Center Blvd. in the Clear Lake area of Houston, TX. Sampling began on April 11th, 2023.
Site Data
Lab Report 4/11/23 | Lab report 4/27/23 | Lab report 5/11/23 | Lab report 5/25/23 | Lab report 6/8/23 | Lab report 6/22/23 | Lab report 8/17/23 | Lab report 8/30/23 | Lab report 9/13/23 | Lab report 9/27/23 | Lab report 10/11/23 | Lab report 10/25/23 | Lab report 11/8/23 | Lab report 11/29/23 | Lab report 12/13/23 | Lab report 1/3/24 | Lab report 1/18/24 | Lab report 1/31/24 | Lab report 2/14/24 | Lab report 2/28/24
ISCO Flowlink Data
Rainfall
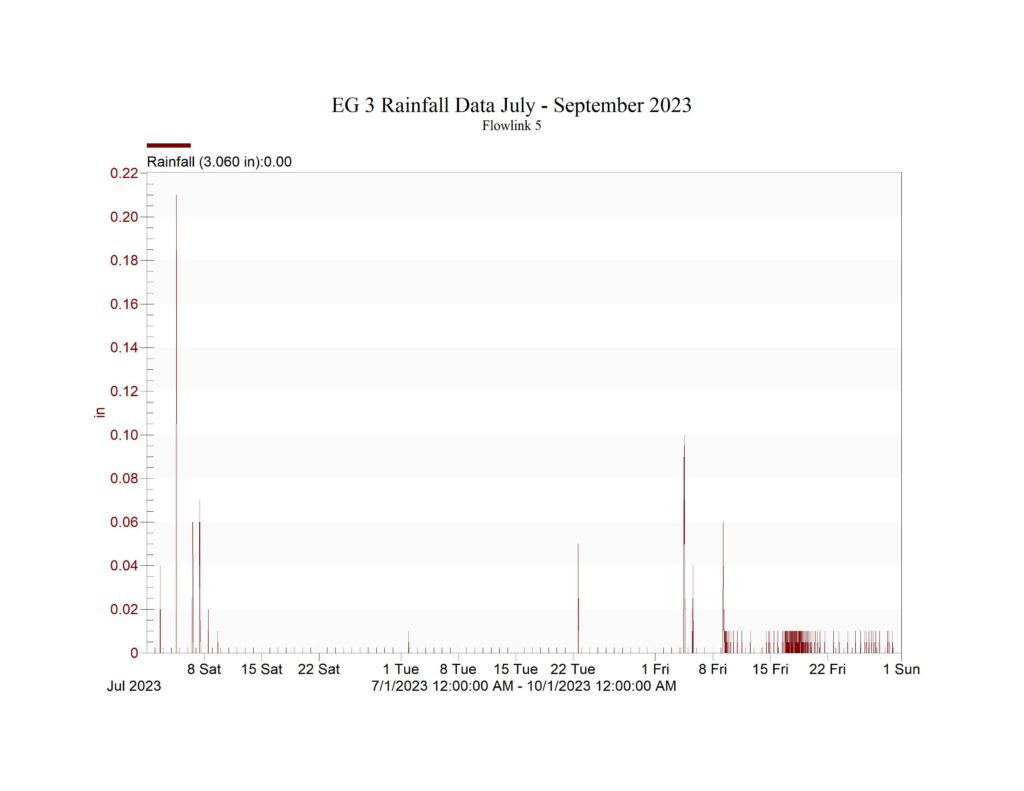
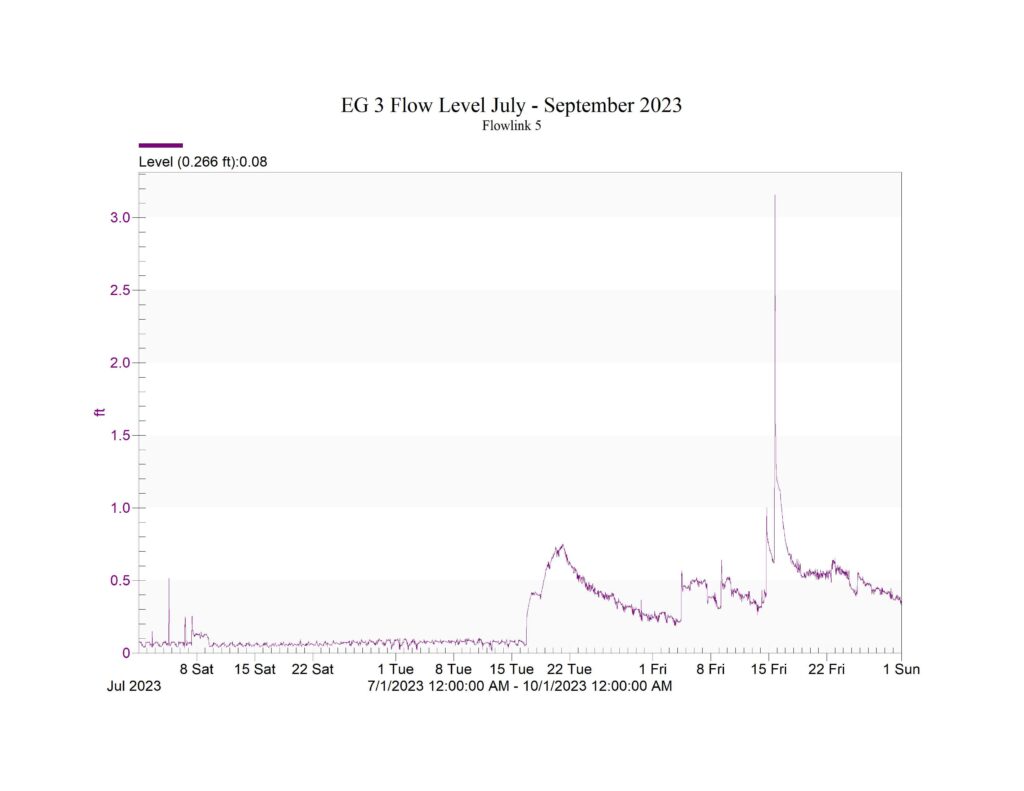
EG 3 Rainfall July – September 2023
Flow
![]()
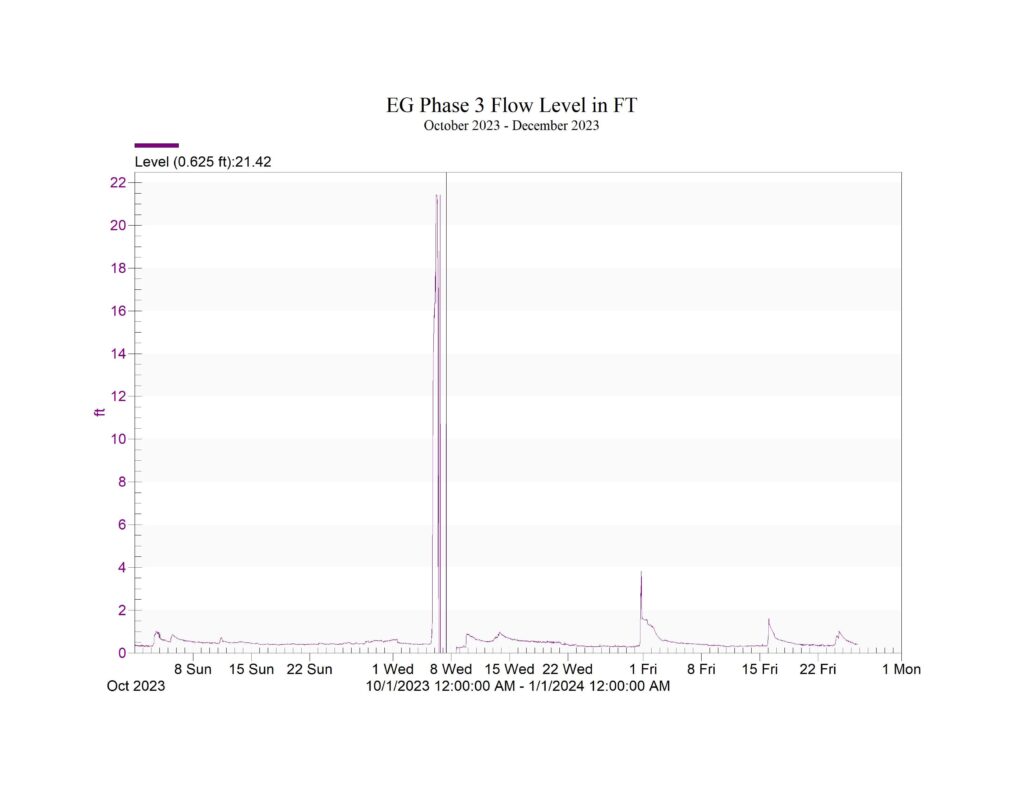
EG 3 Flow Level July- September 2023 | EG 3 Flow Level Oct – December Table | EG 3 Flow level data in ft. Jan -Feb 2024 table
Check back for updates…
Exploration Green Site 4
Location #3: the outfall location between Phases 4 and 5 of Exploration Green located near the 1700 block of Neptune Ln in the Clear Lake area of Houston, TX. Sampling began on April 4th, 2023.
Site Data
Lab report 4/11/23 | Lab report 4/27/23 | Lab report 5/11/23 | Lab report 5/25/23 | Lab report 6/8/23 | Lab report 6/22/23 | Lab report 7/6/23 | Lab report 7/20/23 | Lap report 8/3/23 | Lab report 8/17/23 | Lab report 8/30/23 | Lab report 9/13/23 | Lab report 9/27/23 | Lab report 10/11/23 | Lab report 10/25/23 | Lab report 11/8/23 | Lab report 11/29/23 | Lab report 12/13/23 | Lab report 1/3/24 | Lab report 1/18/24 | Lab report 1/31/24 | Lab report 2/14/24 | Lab report 2/28/24
ISCO Flowlink Data
Rainfall
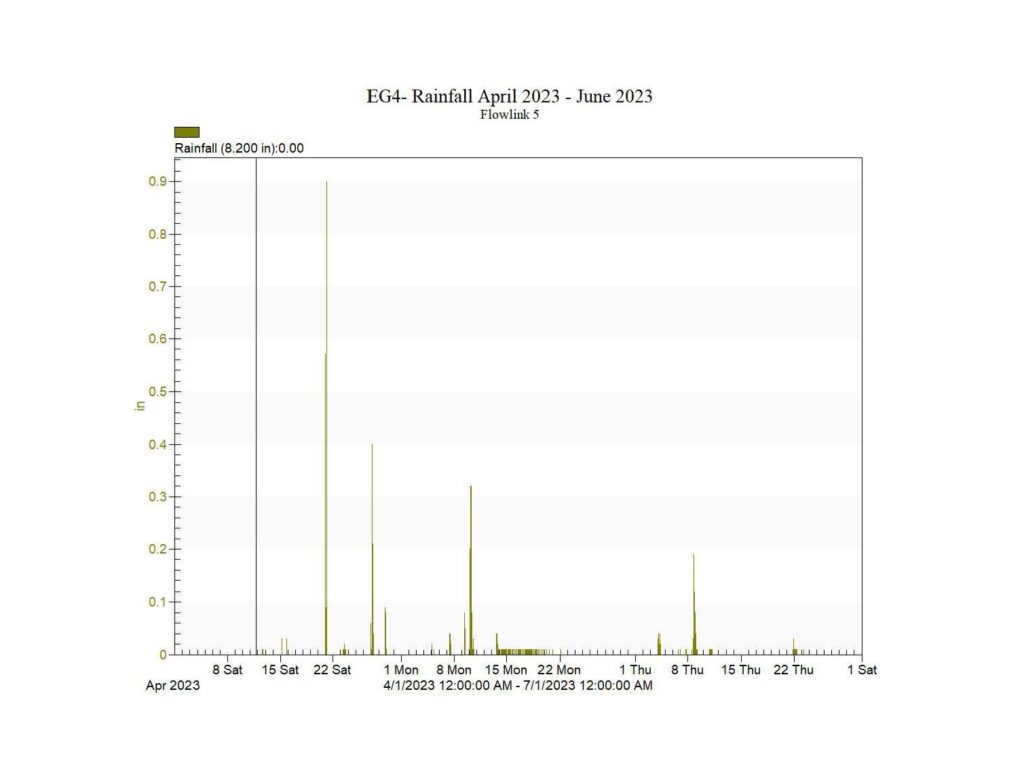
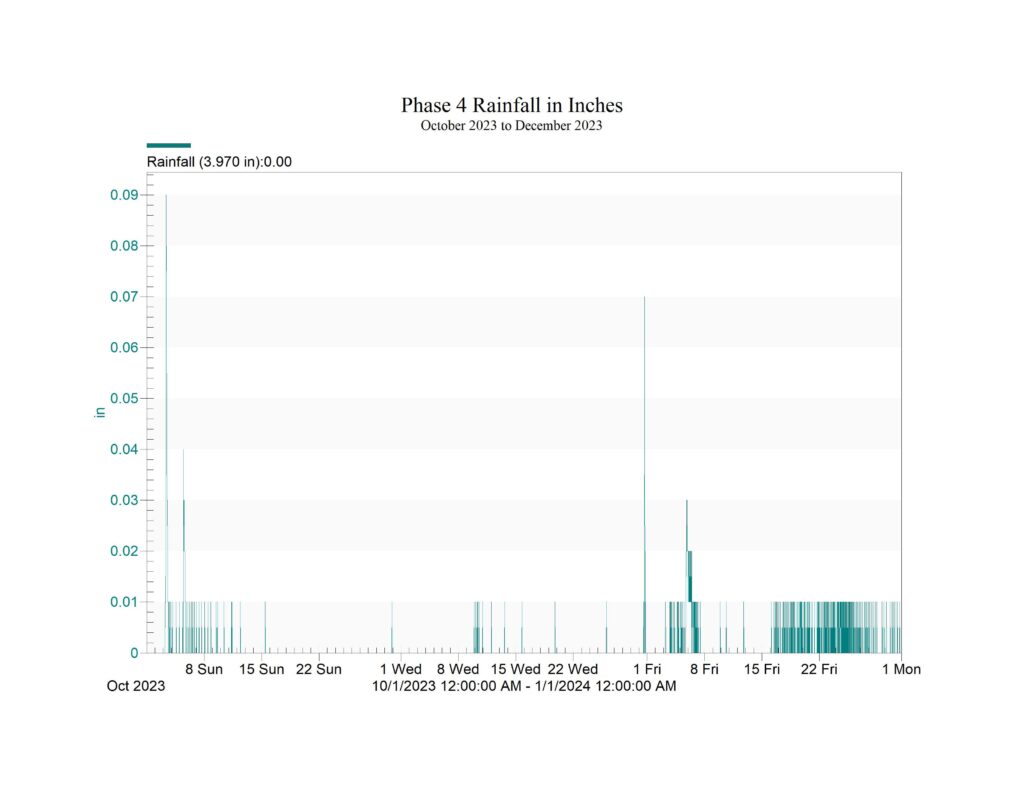
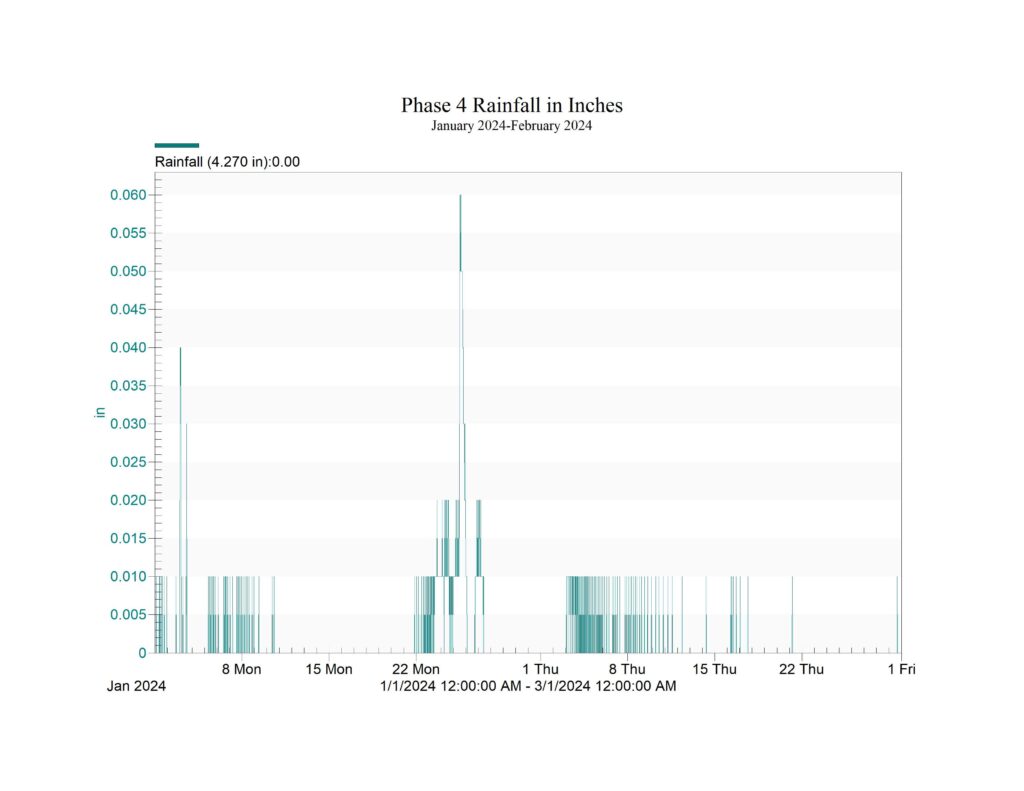
EG4-Rainfall April-June 2023 | EG 4 Rainfall Oct. 2023 – February 2024 Table
Flow
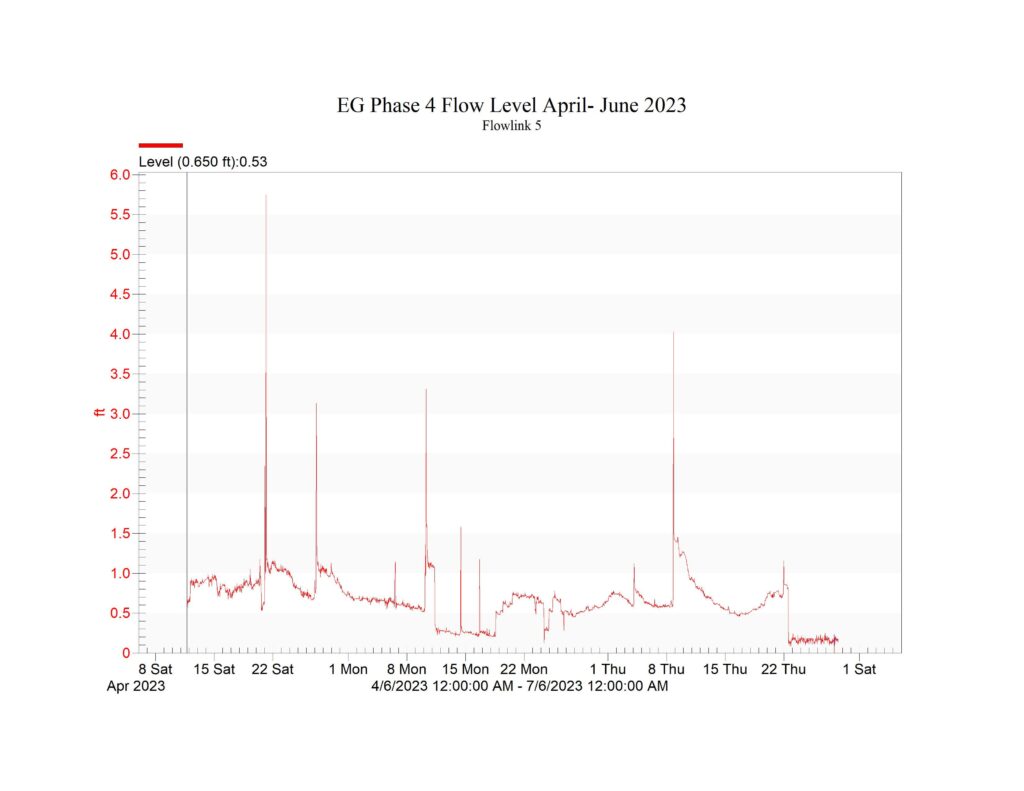
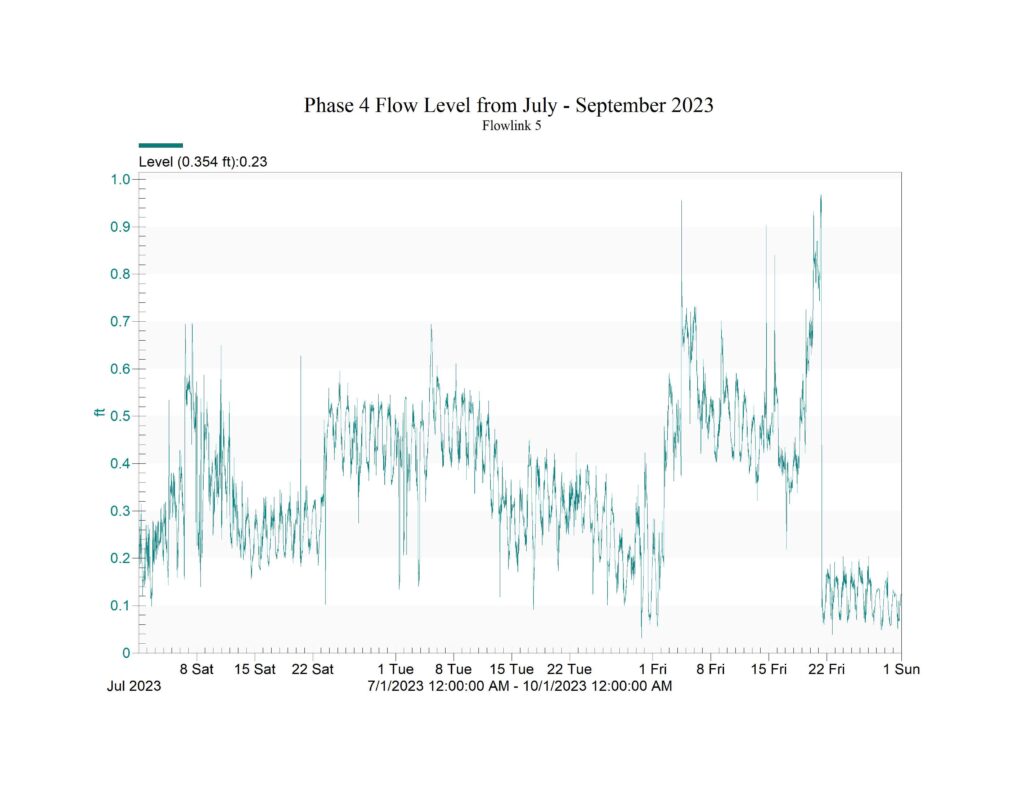
EG4-Flow Levels Table April-June 2023 | EG 4 Flow Level Table July-September 2023 | EG 4 Flow Level Table Oct.2023 -February 2024
Check back for updates…
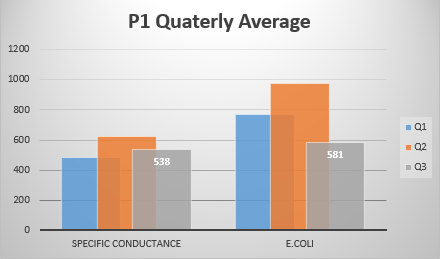
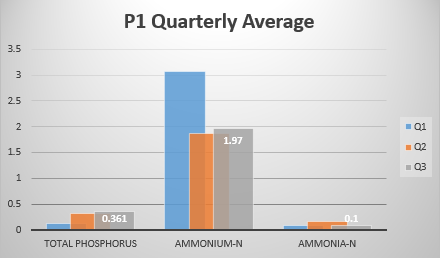
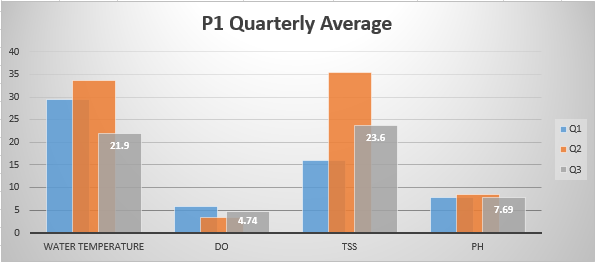
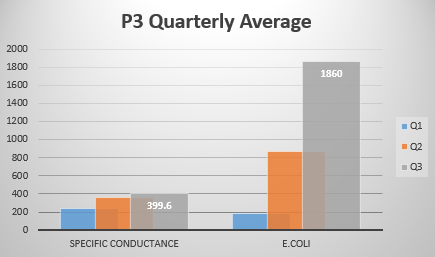
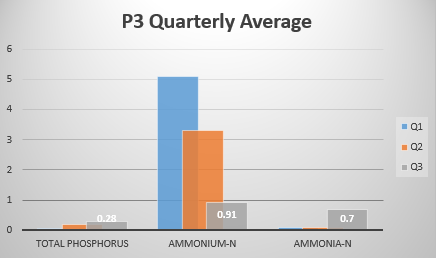
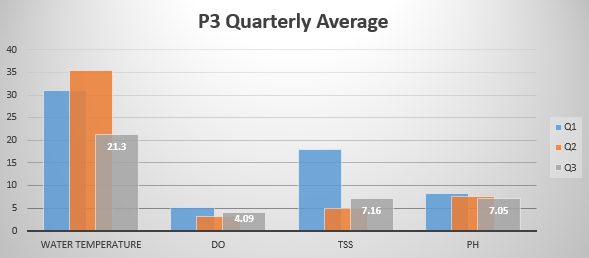
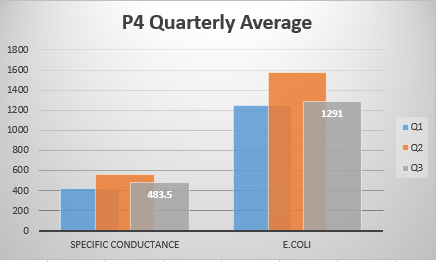
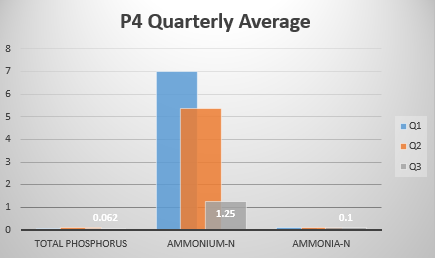
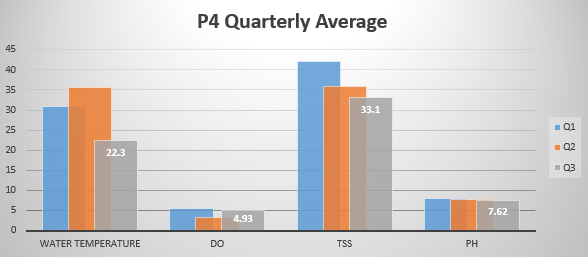
Comparative Data Charts
data consists of all field samples collected so far
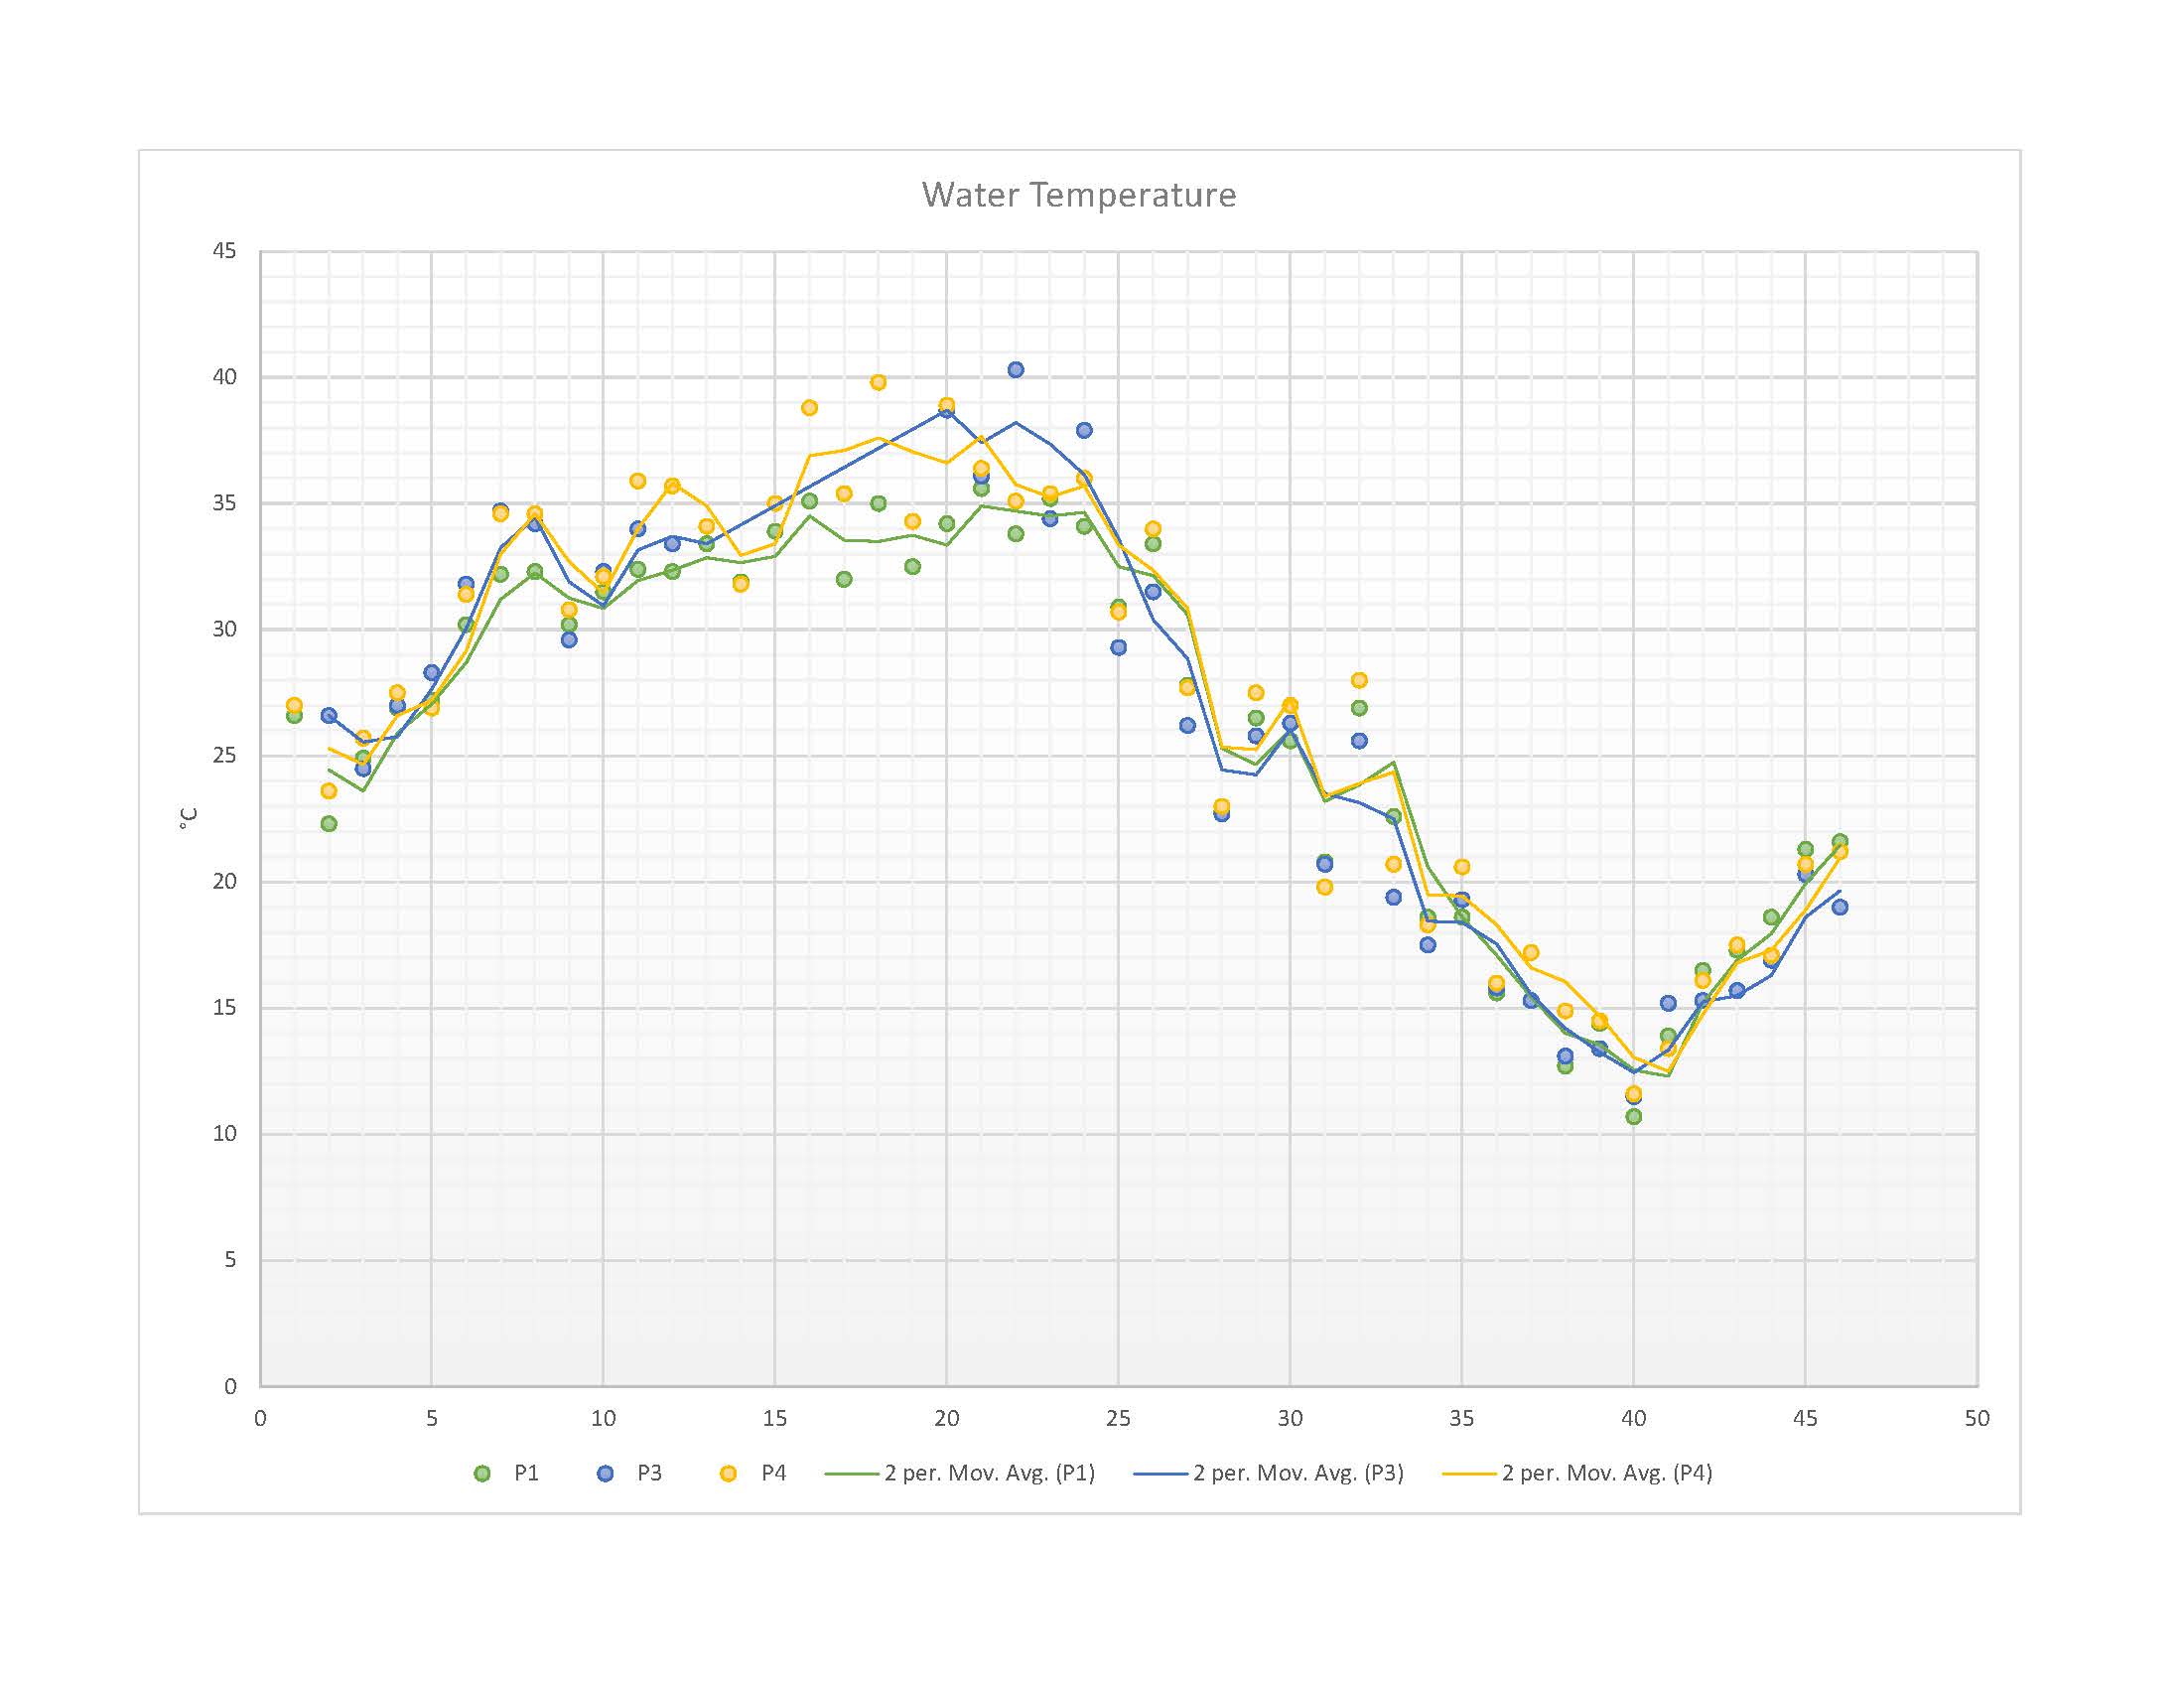
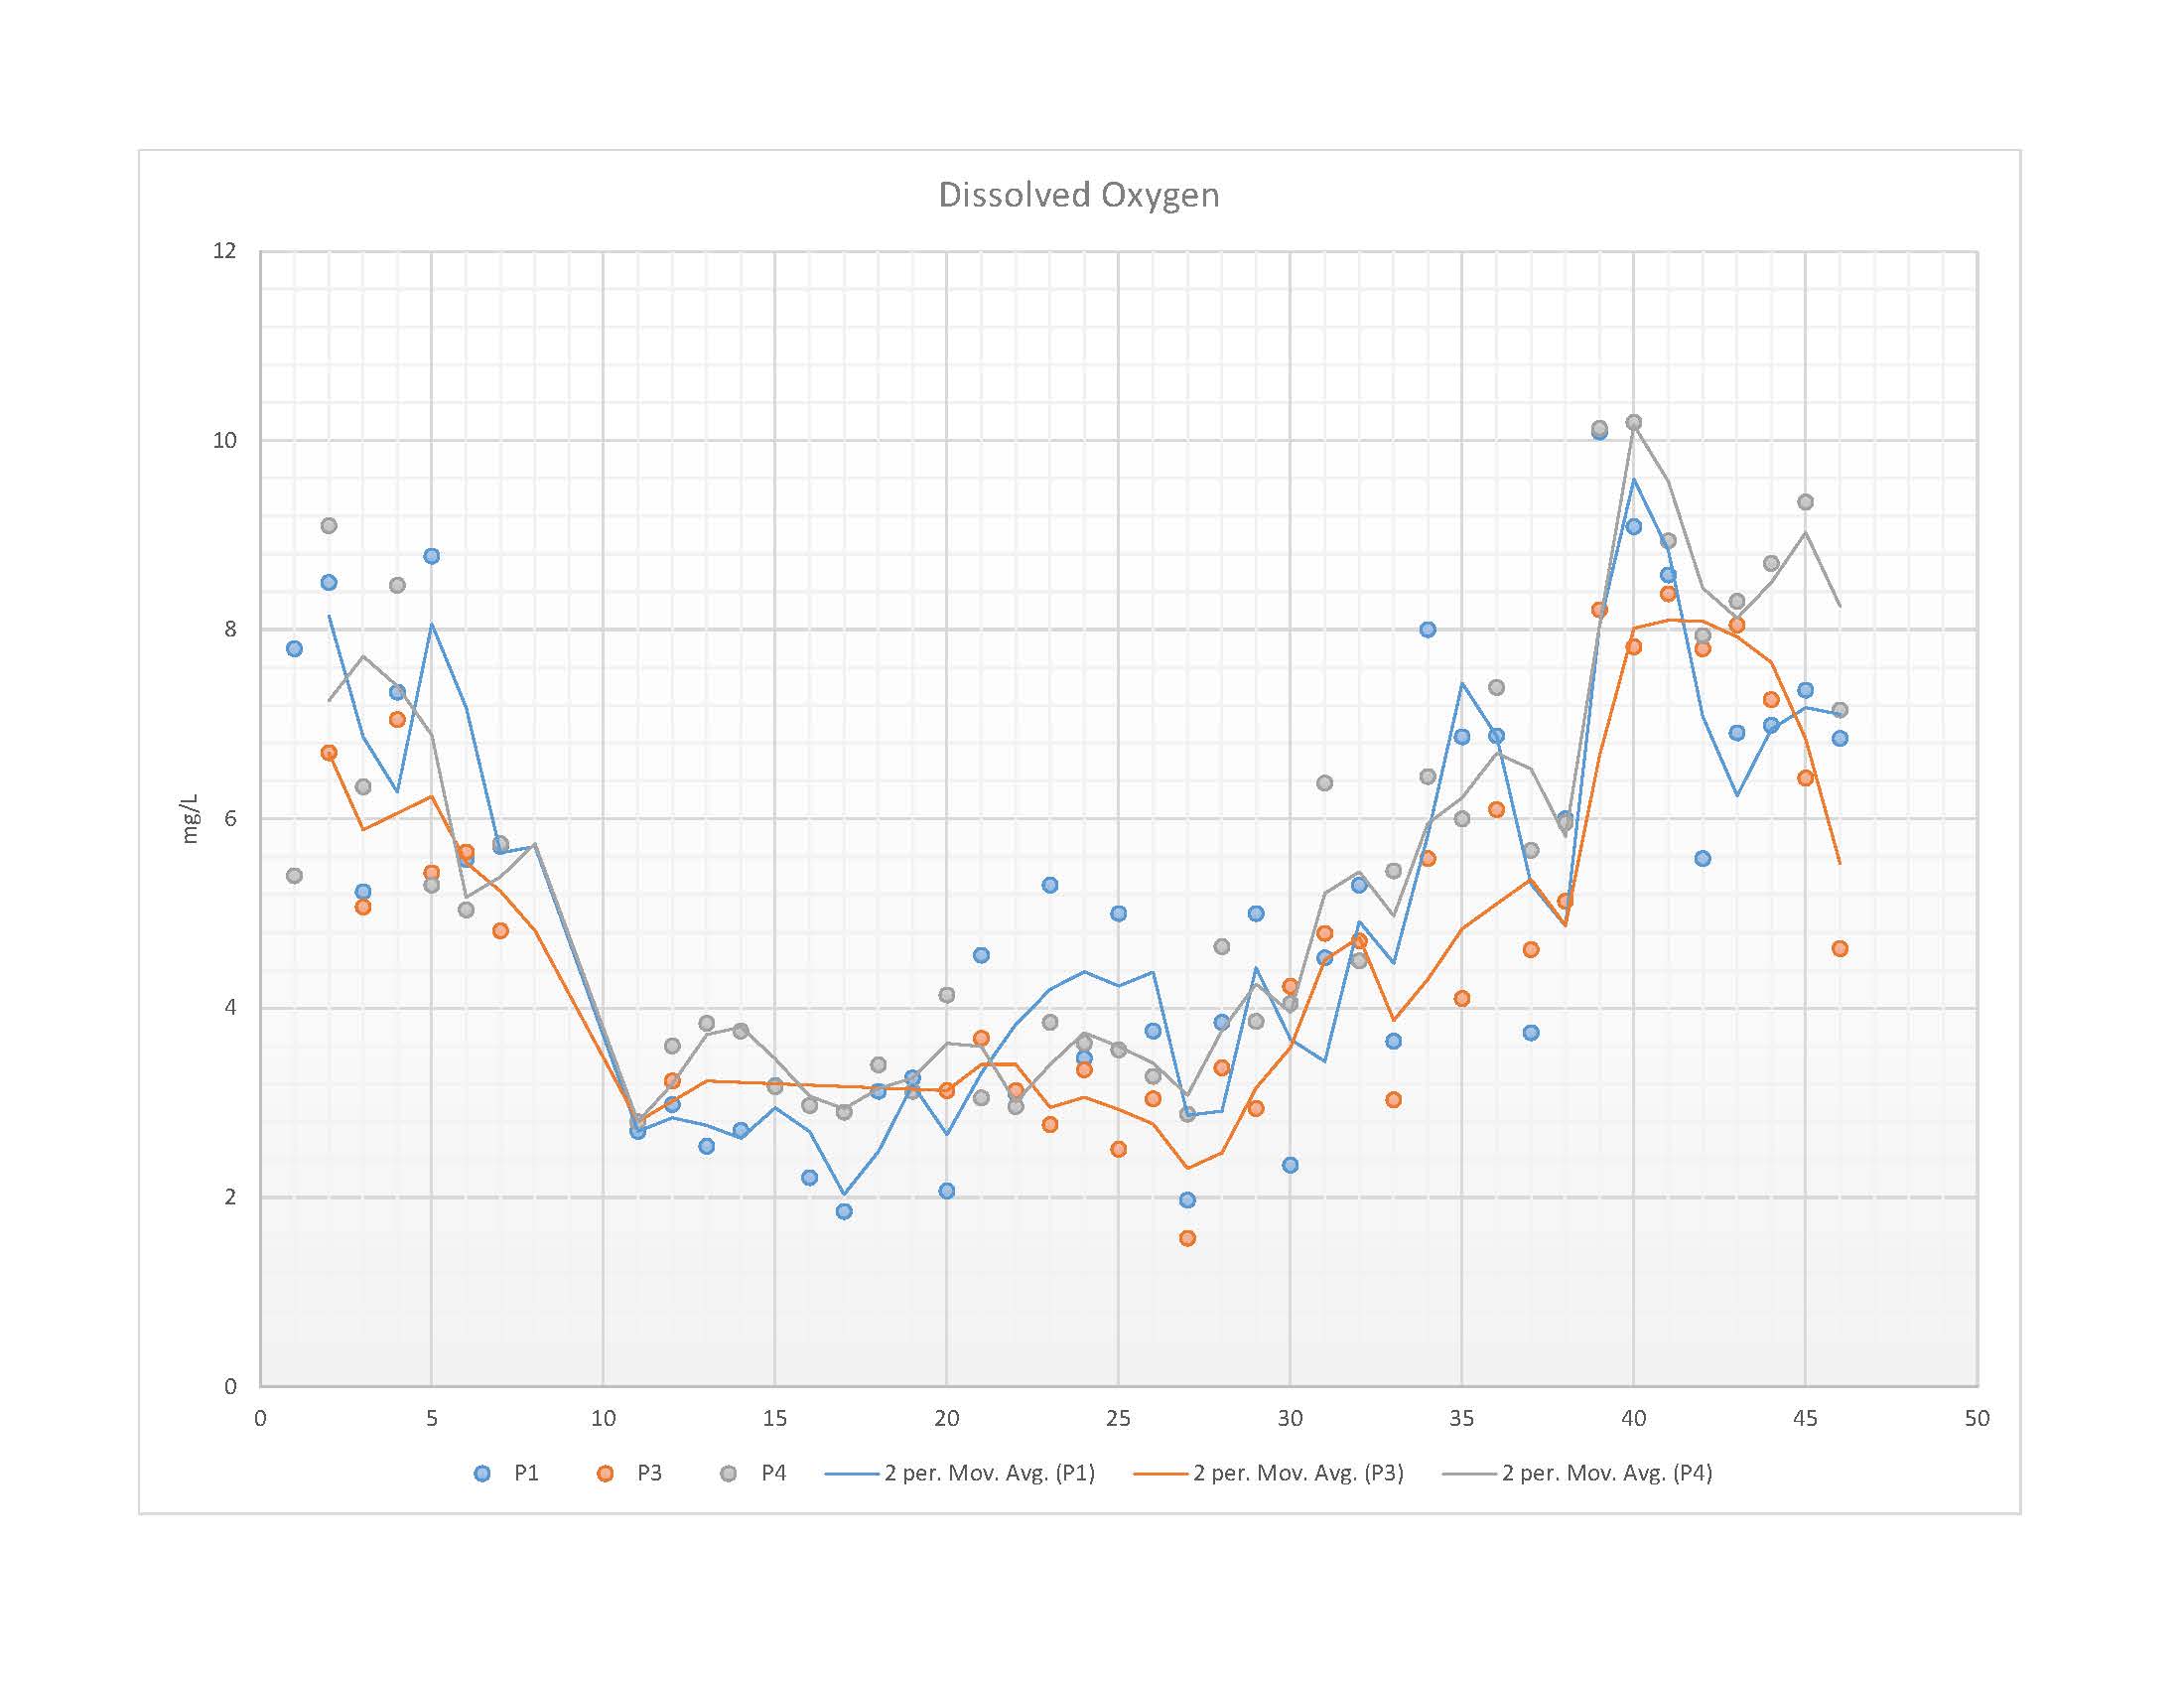
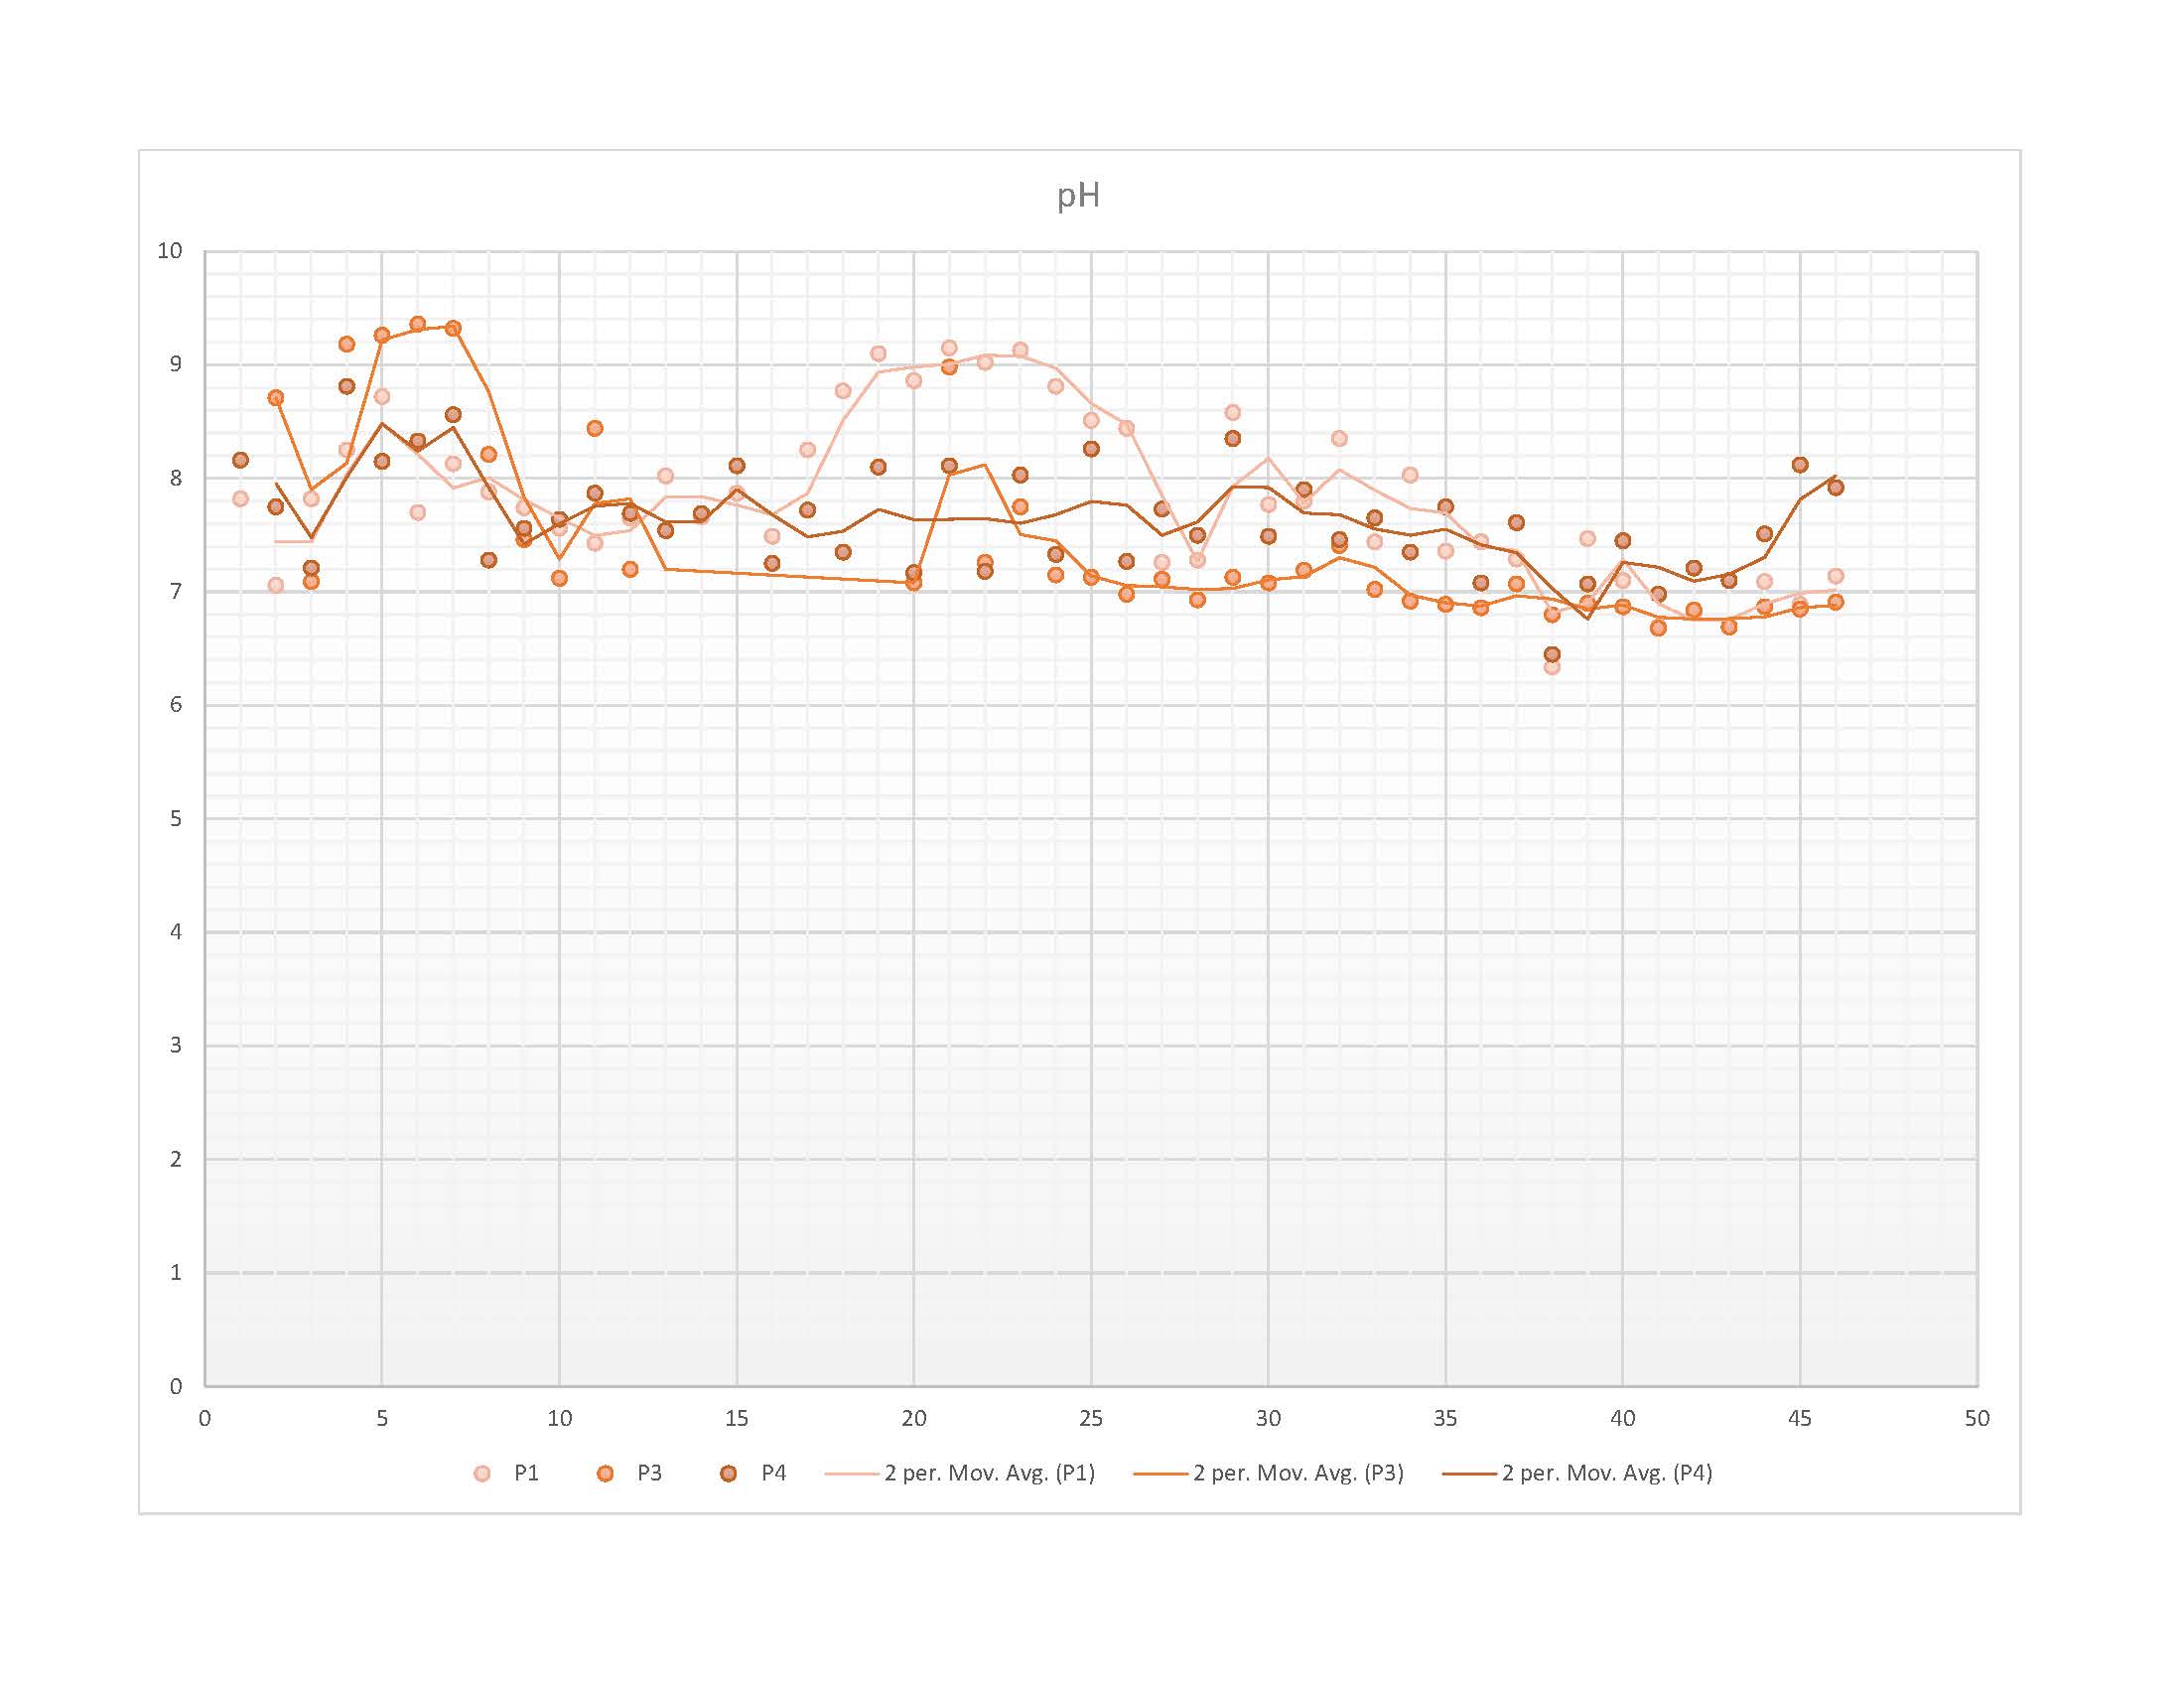
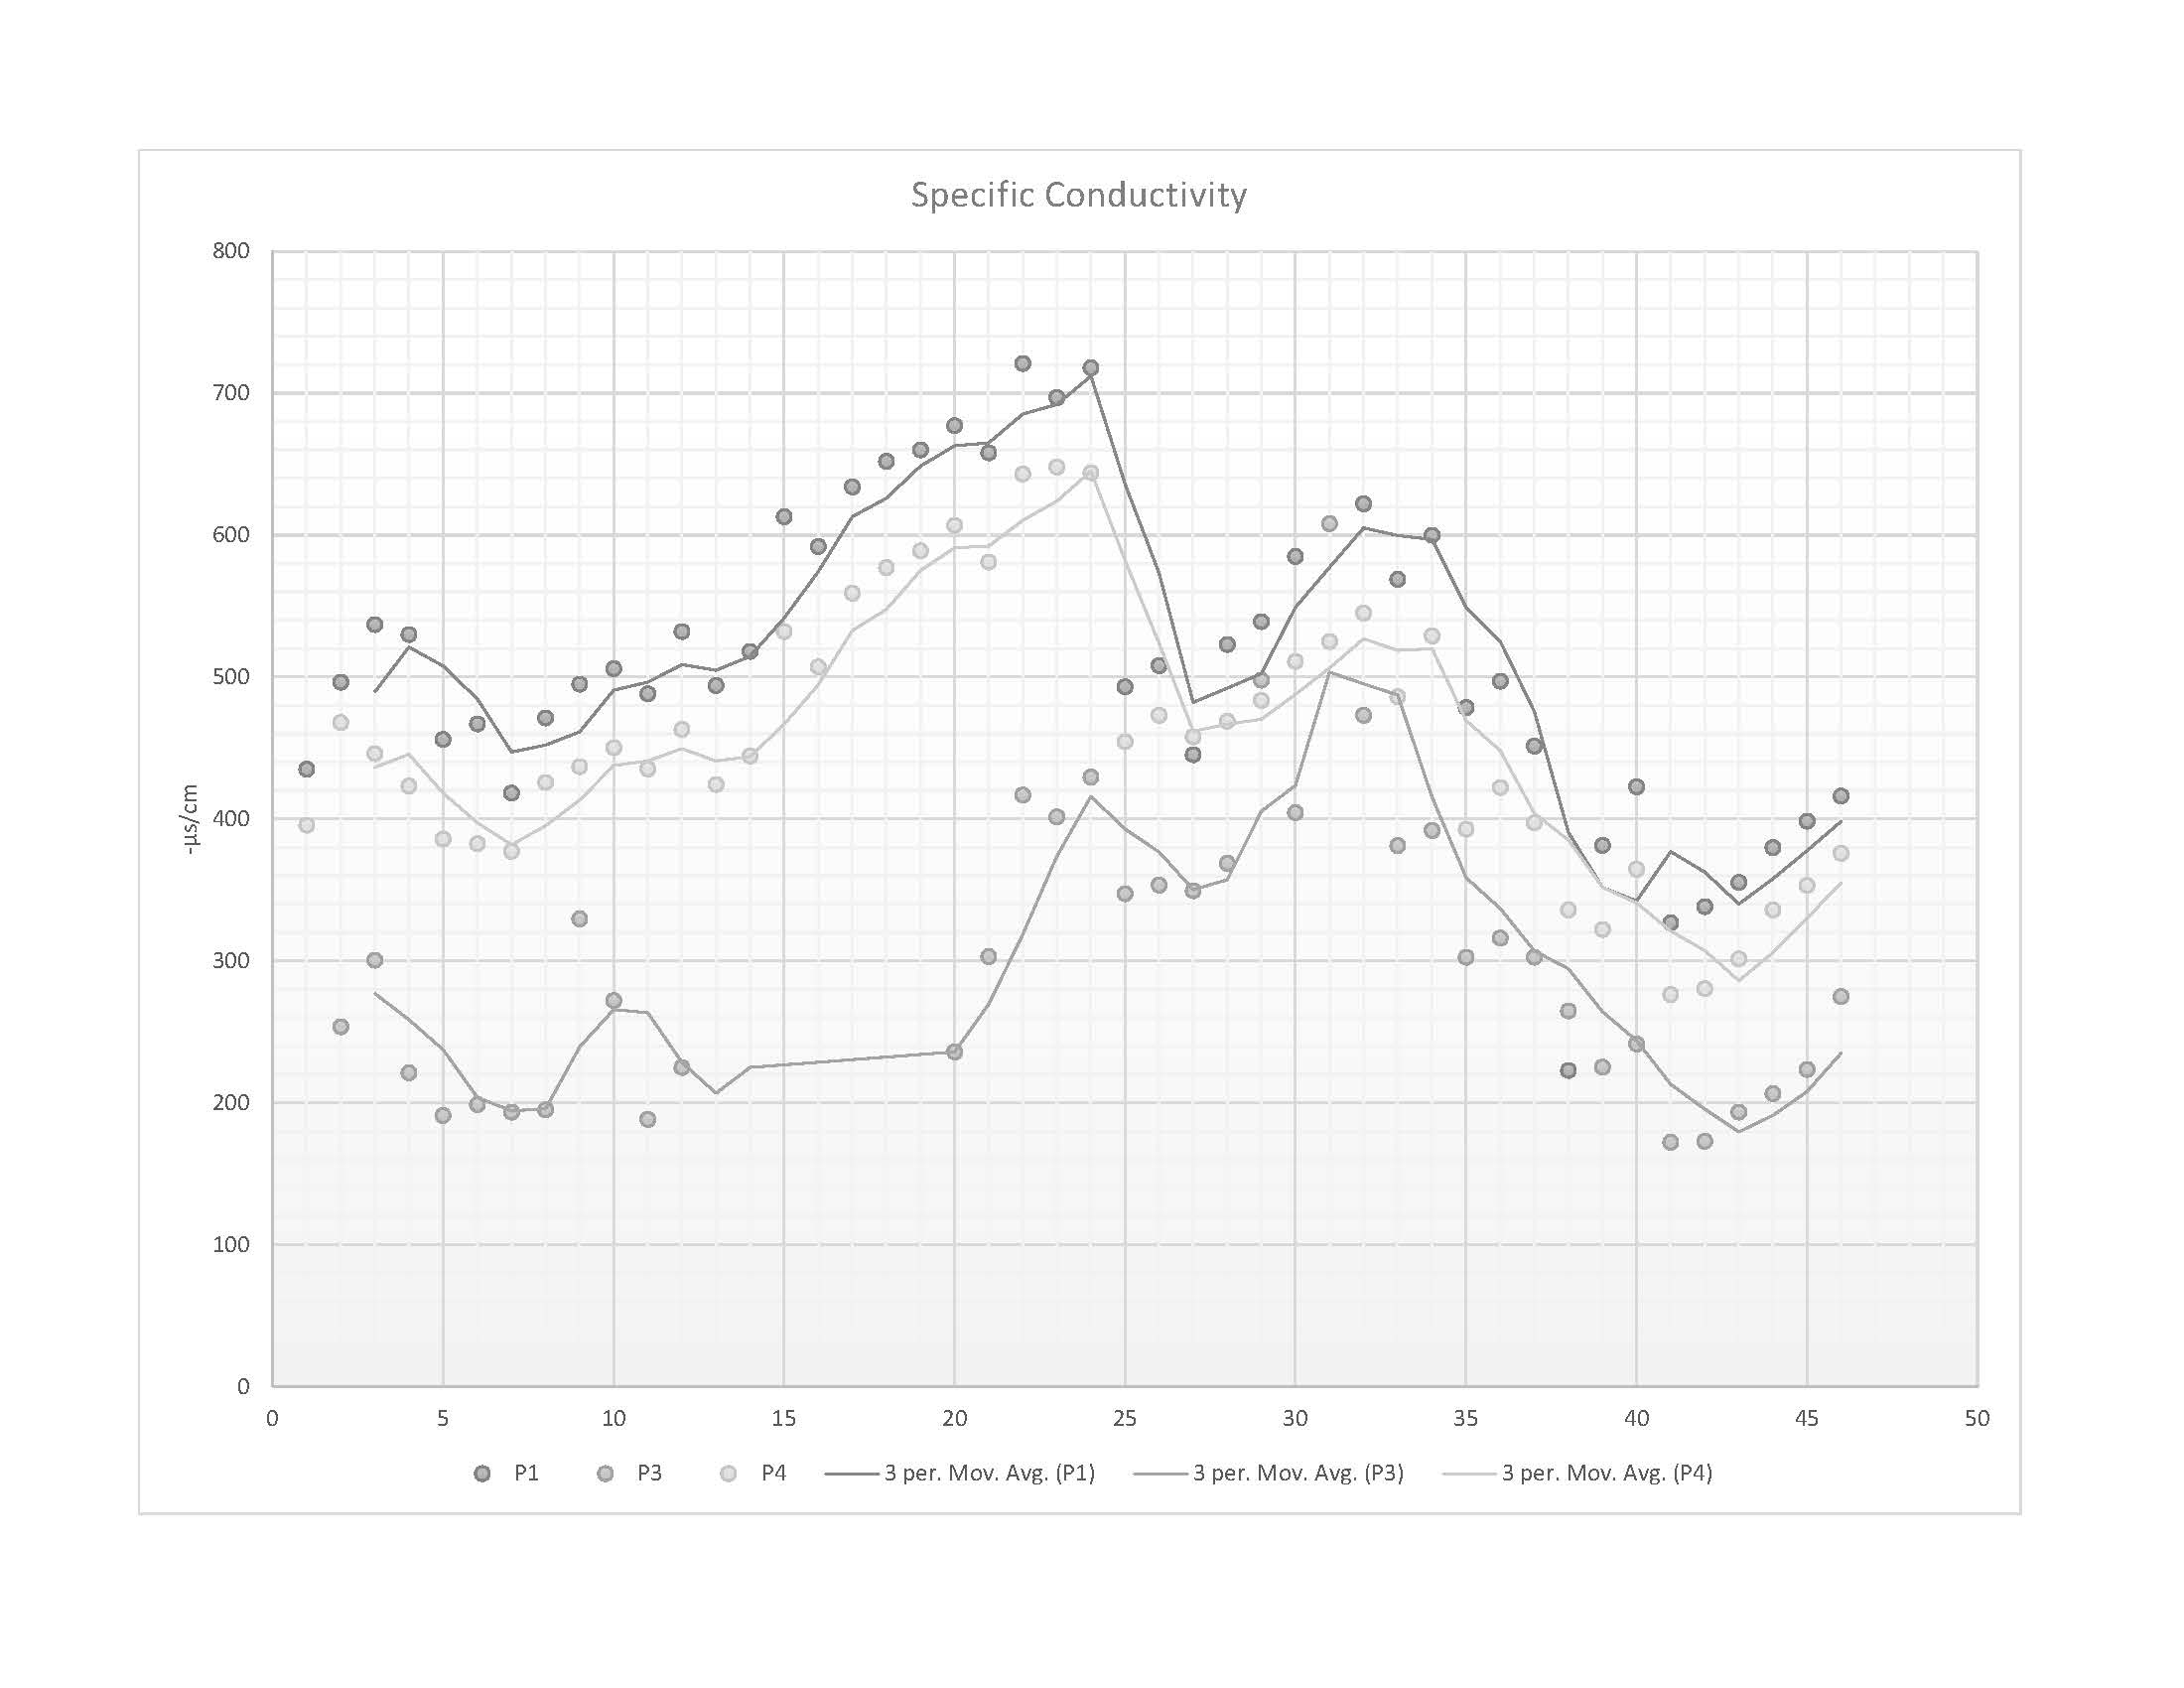
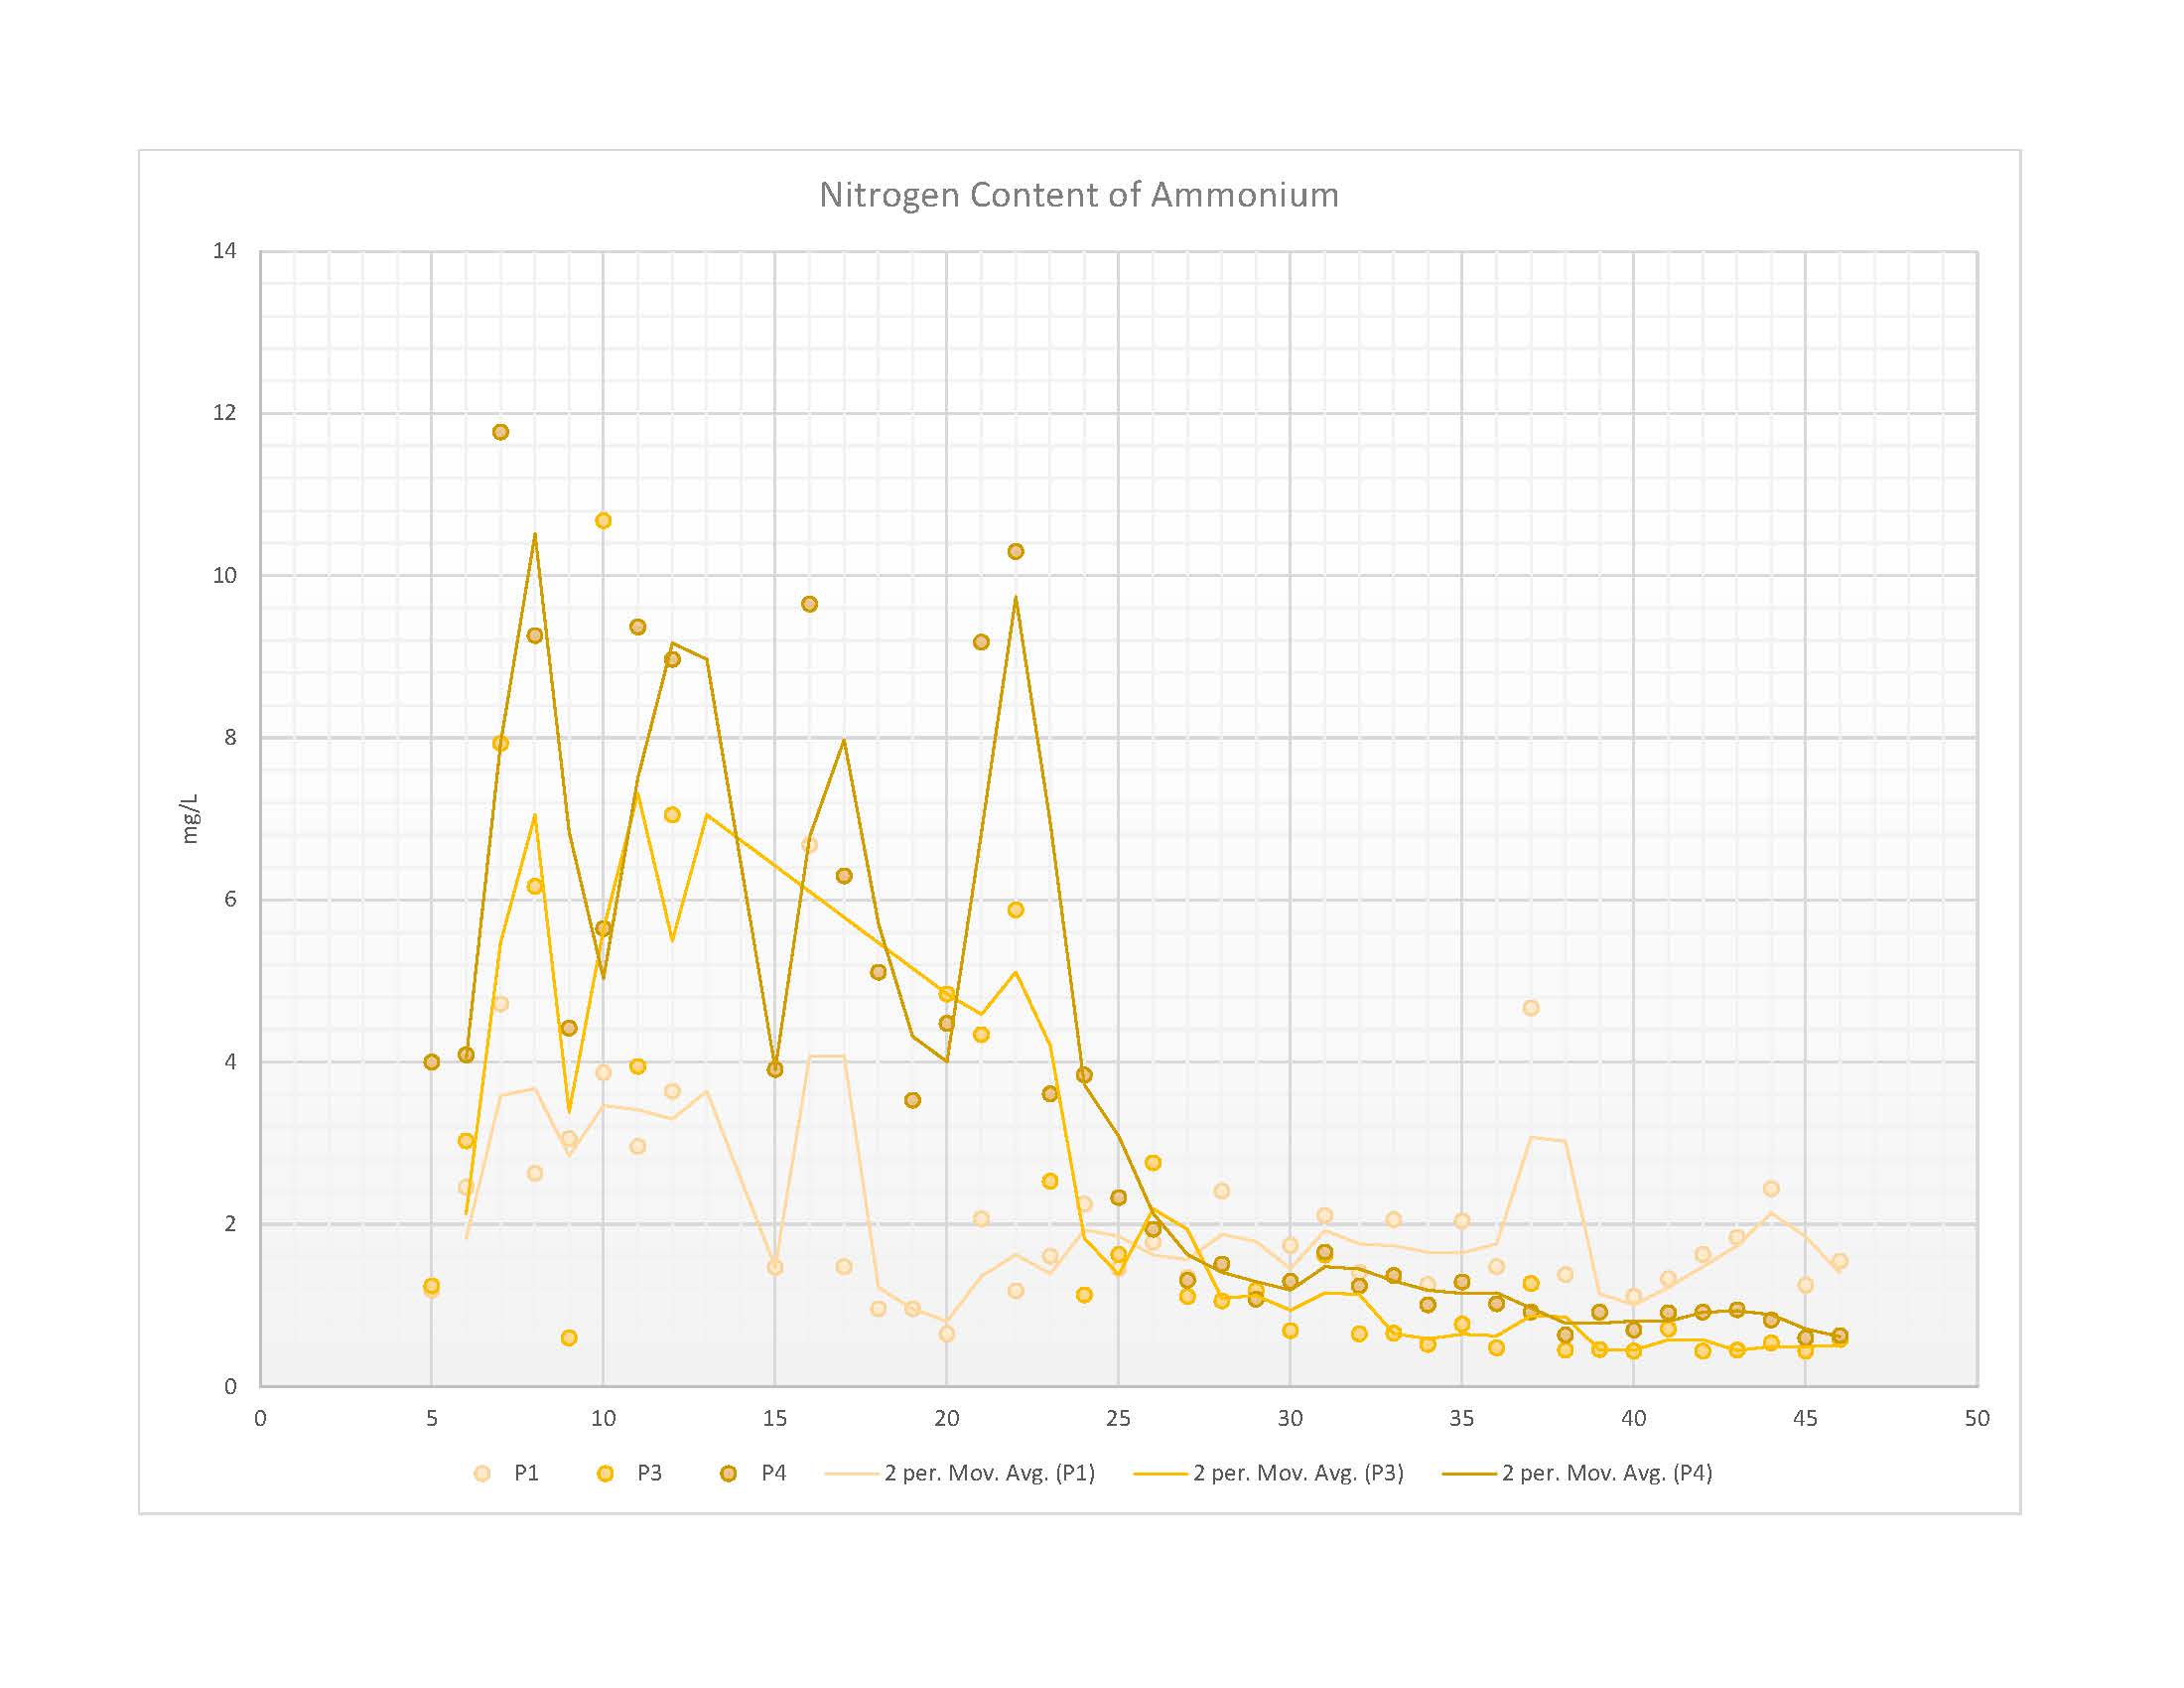
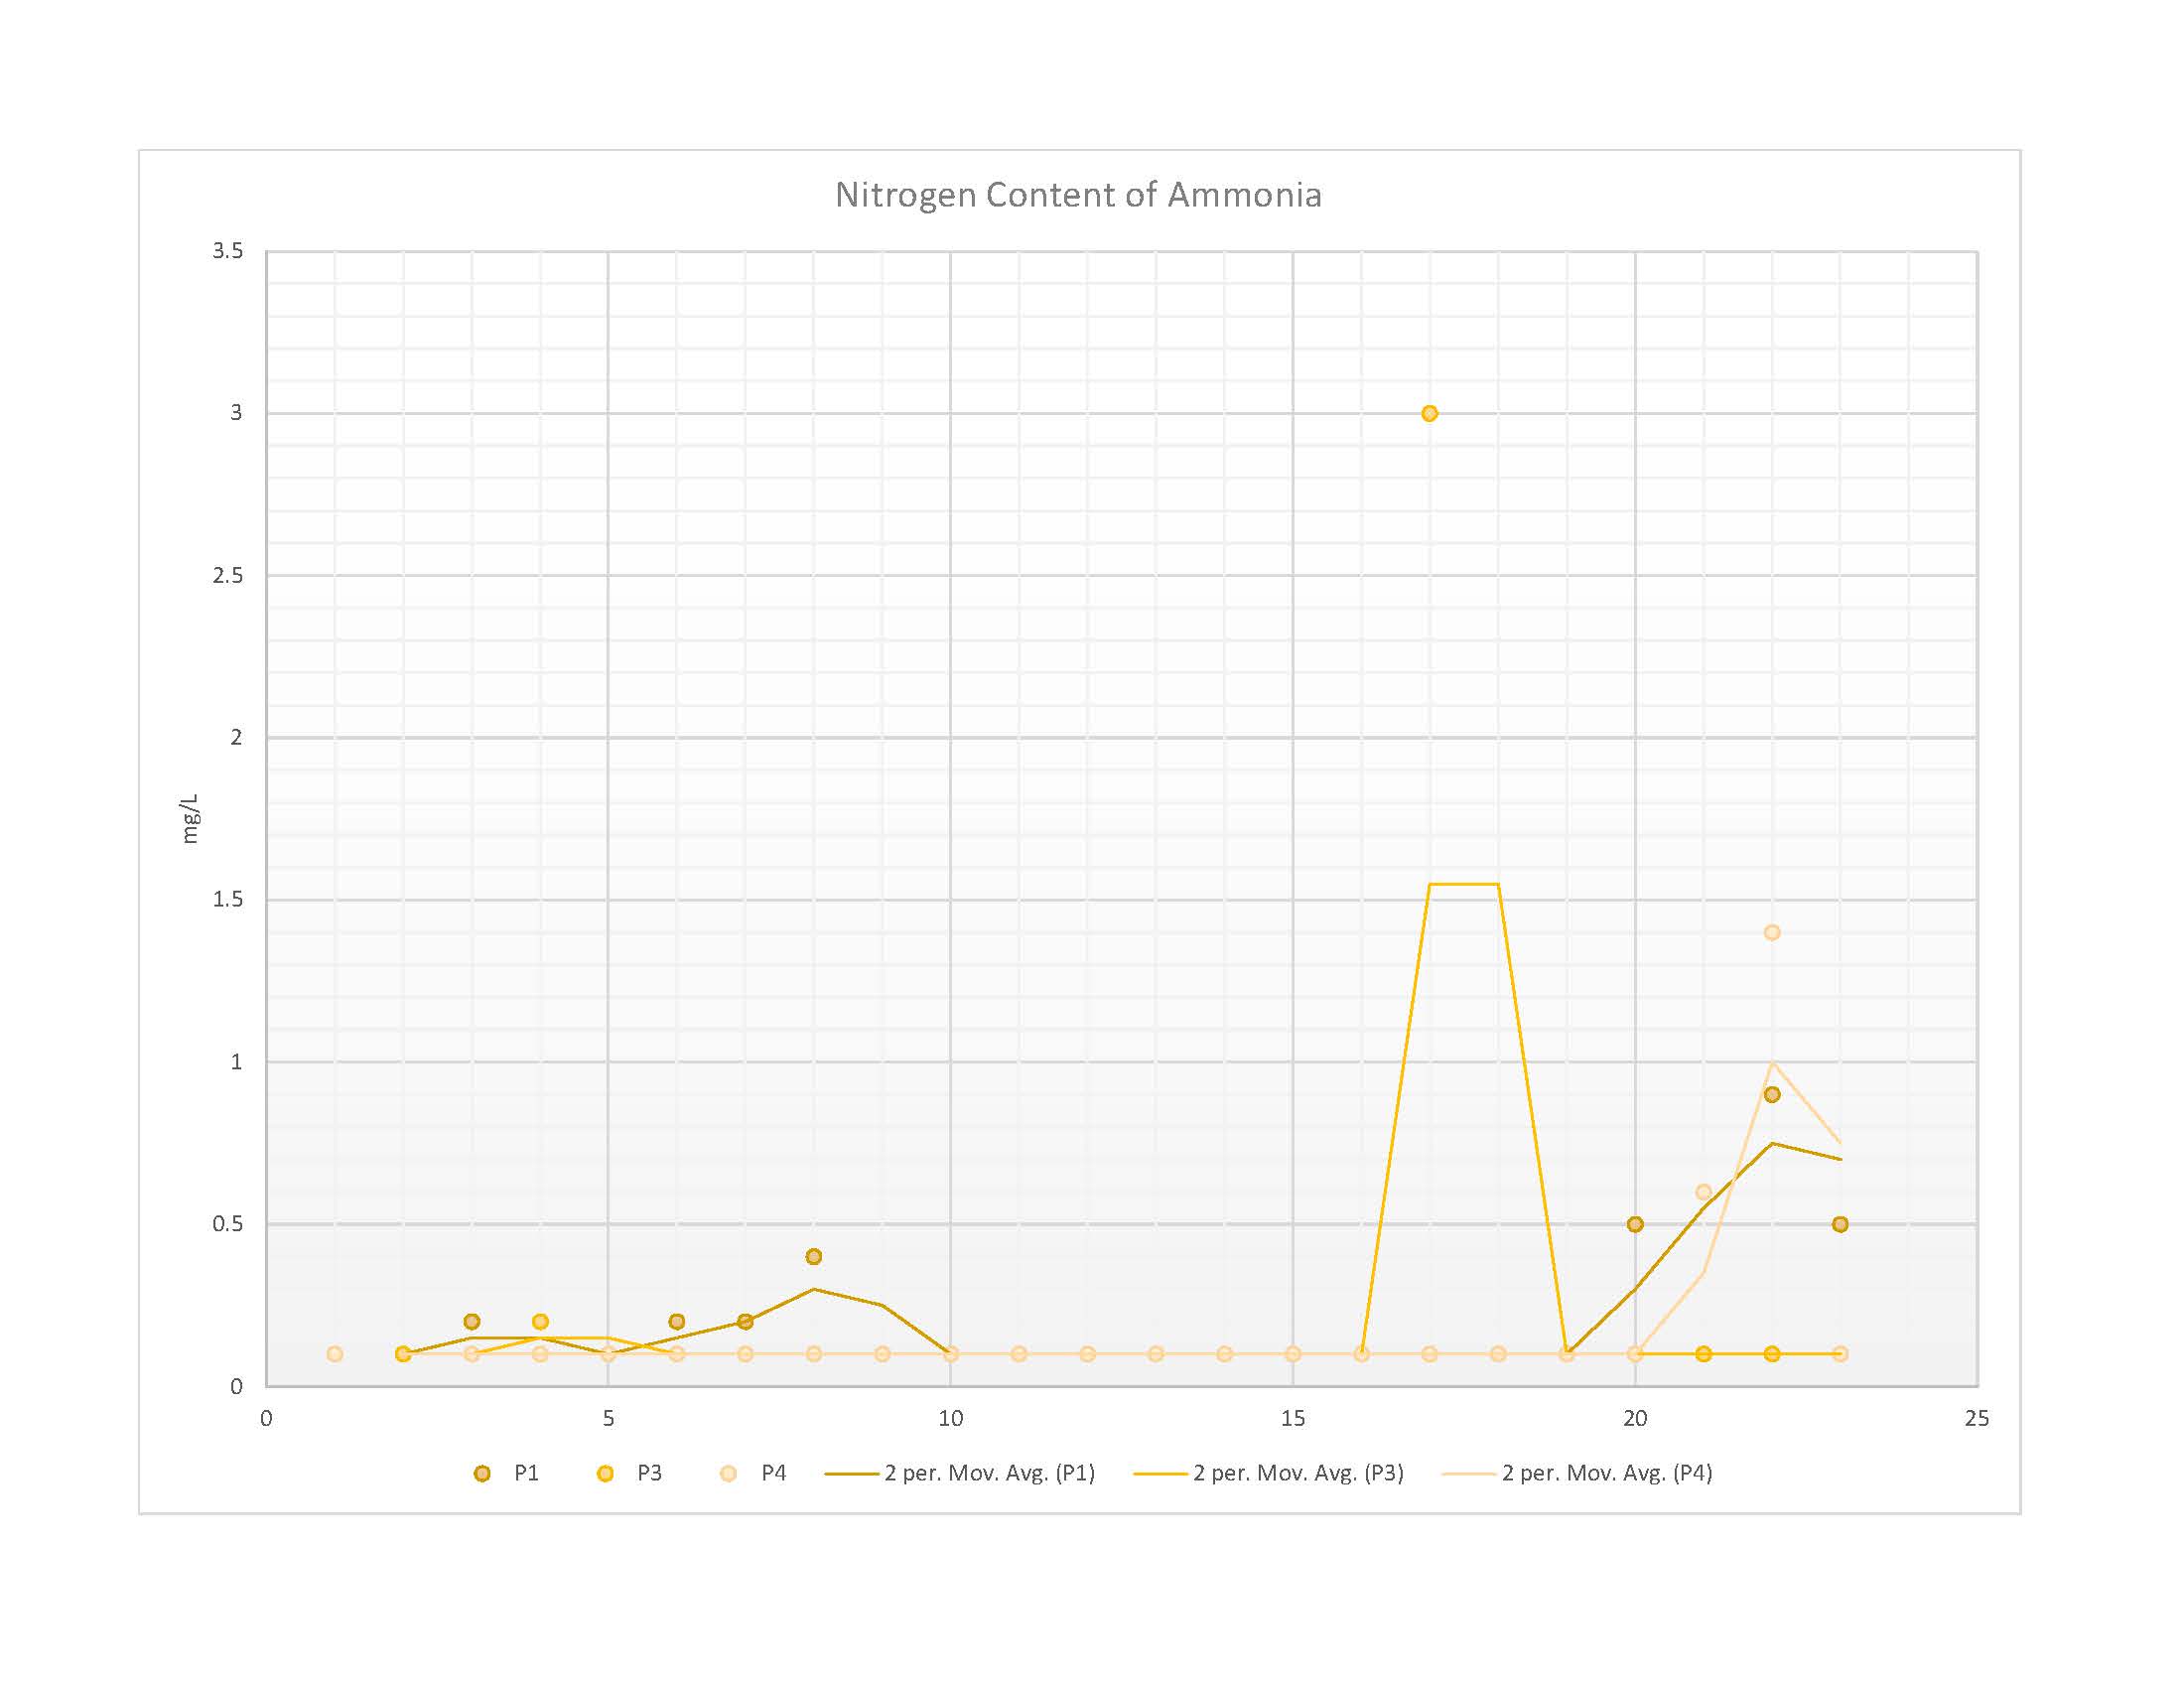
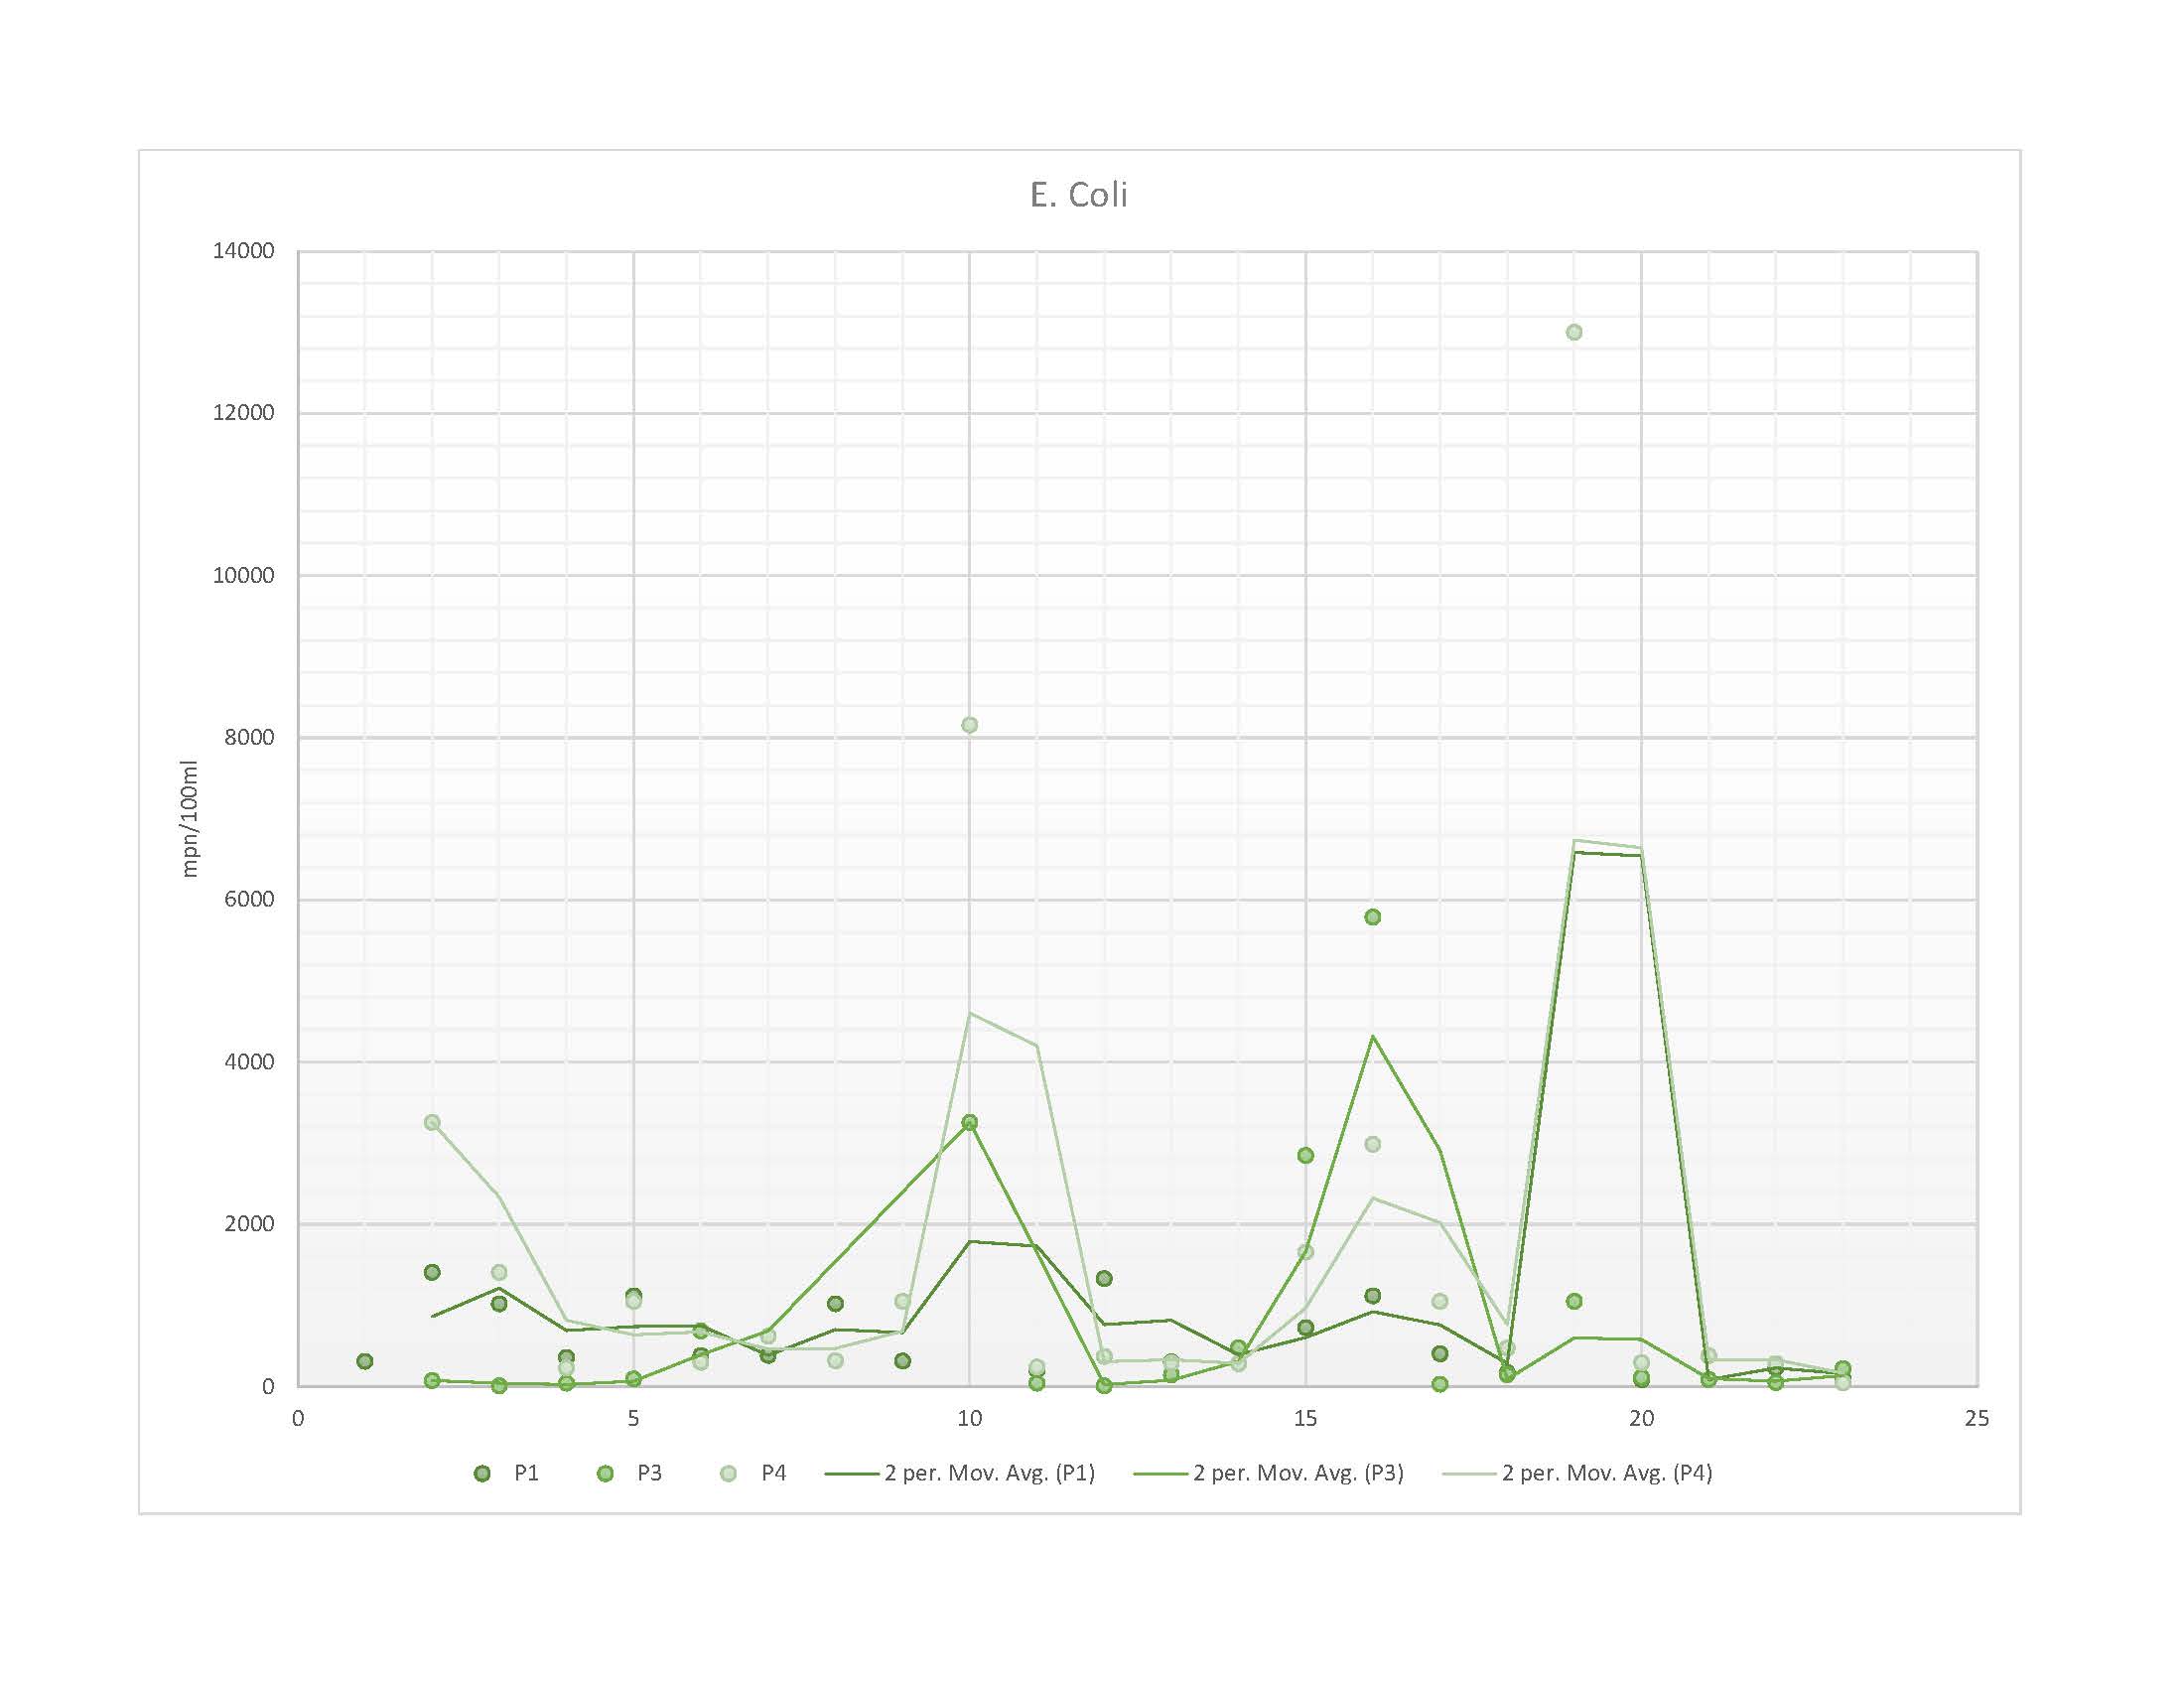
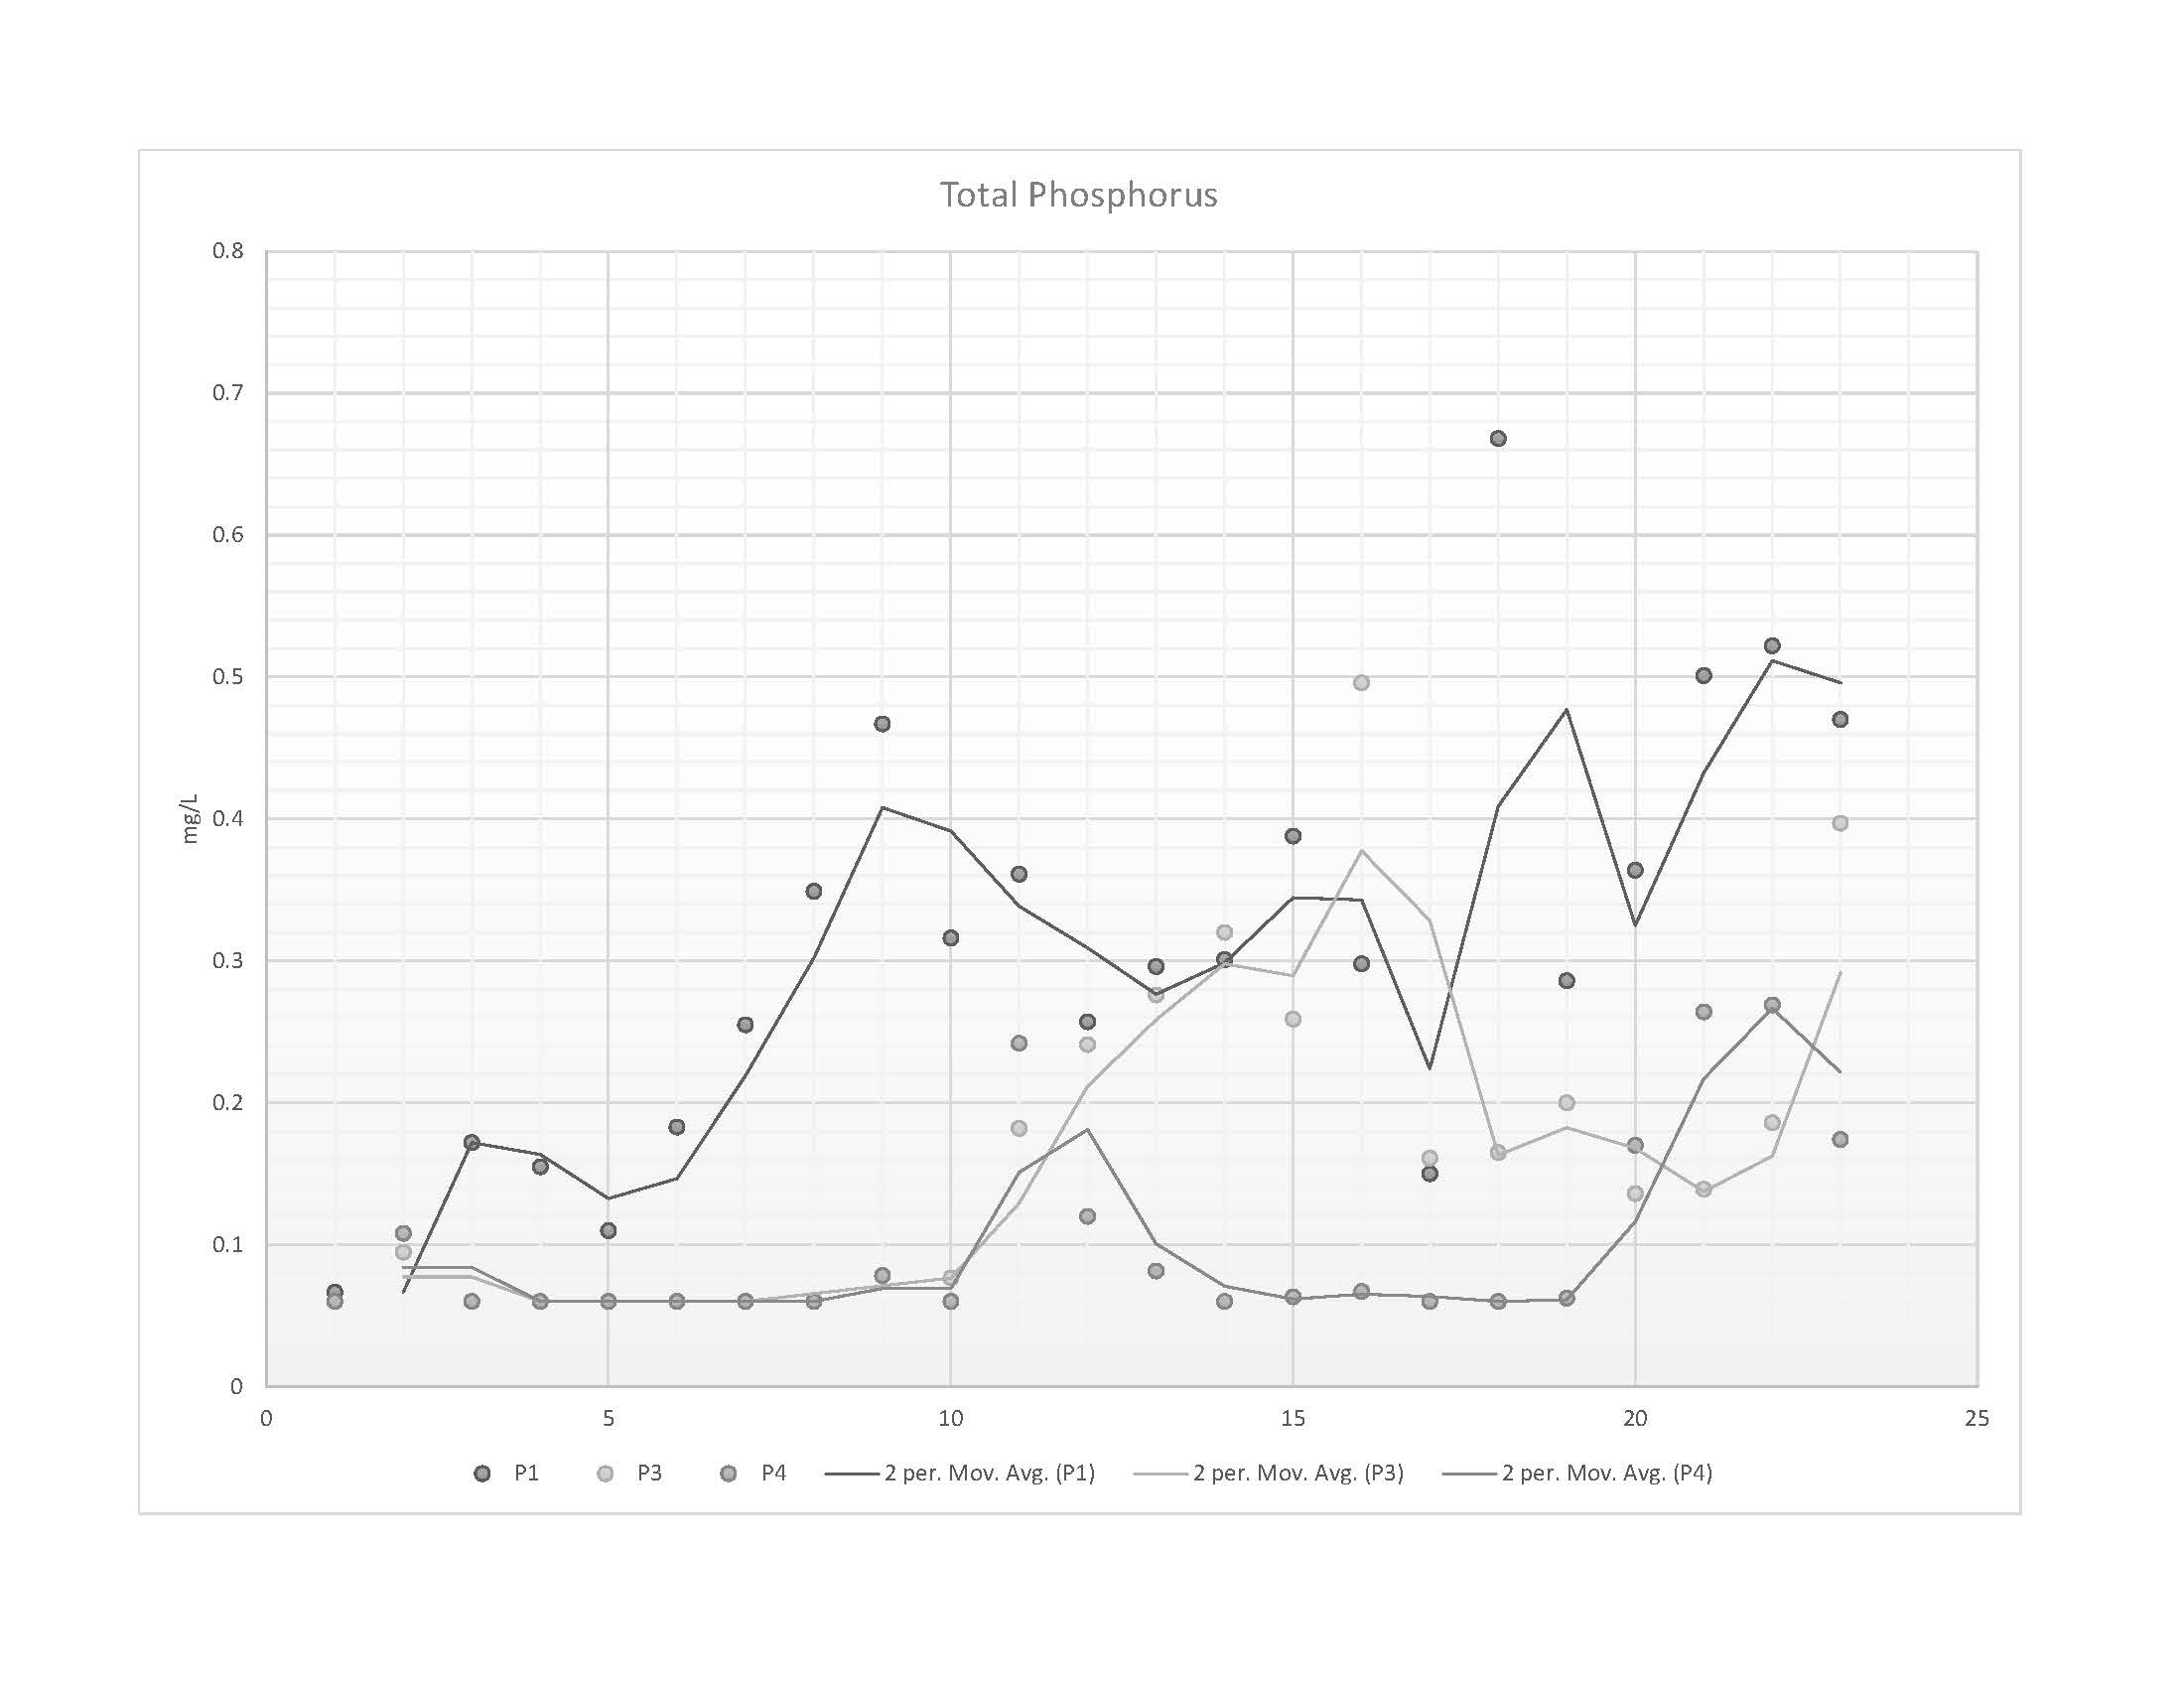
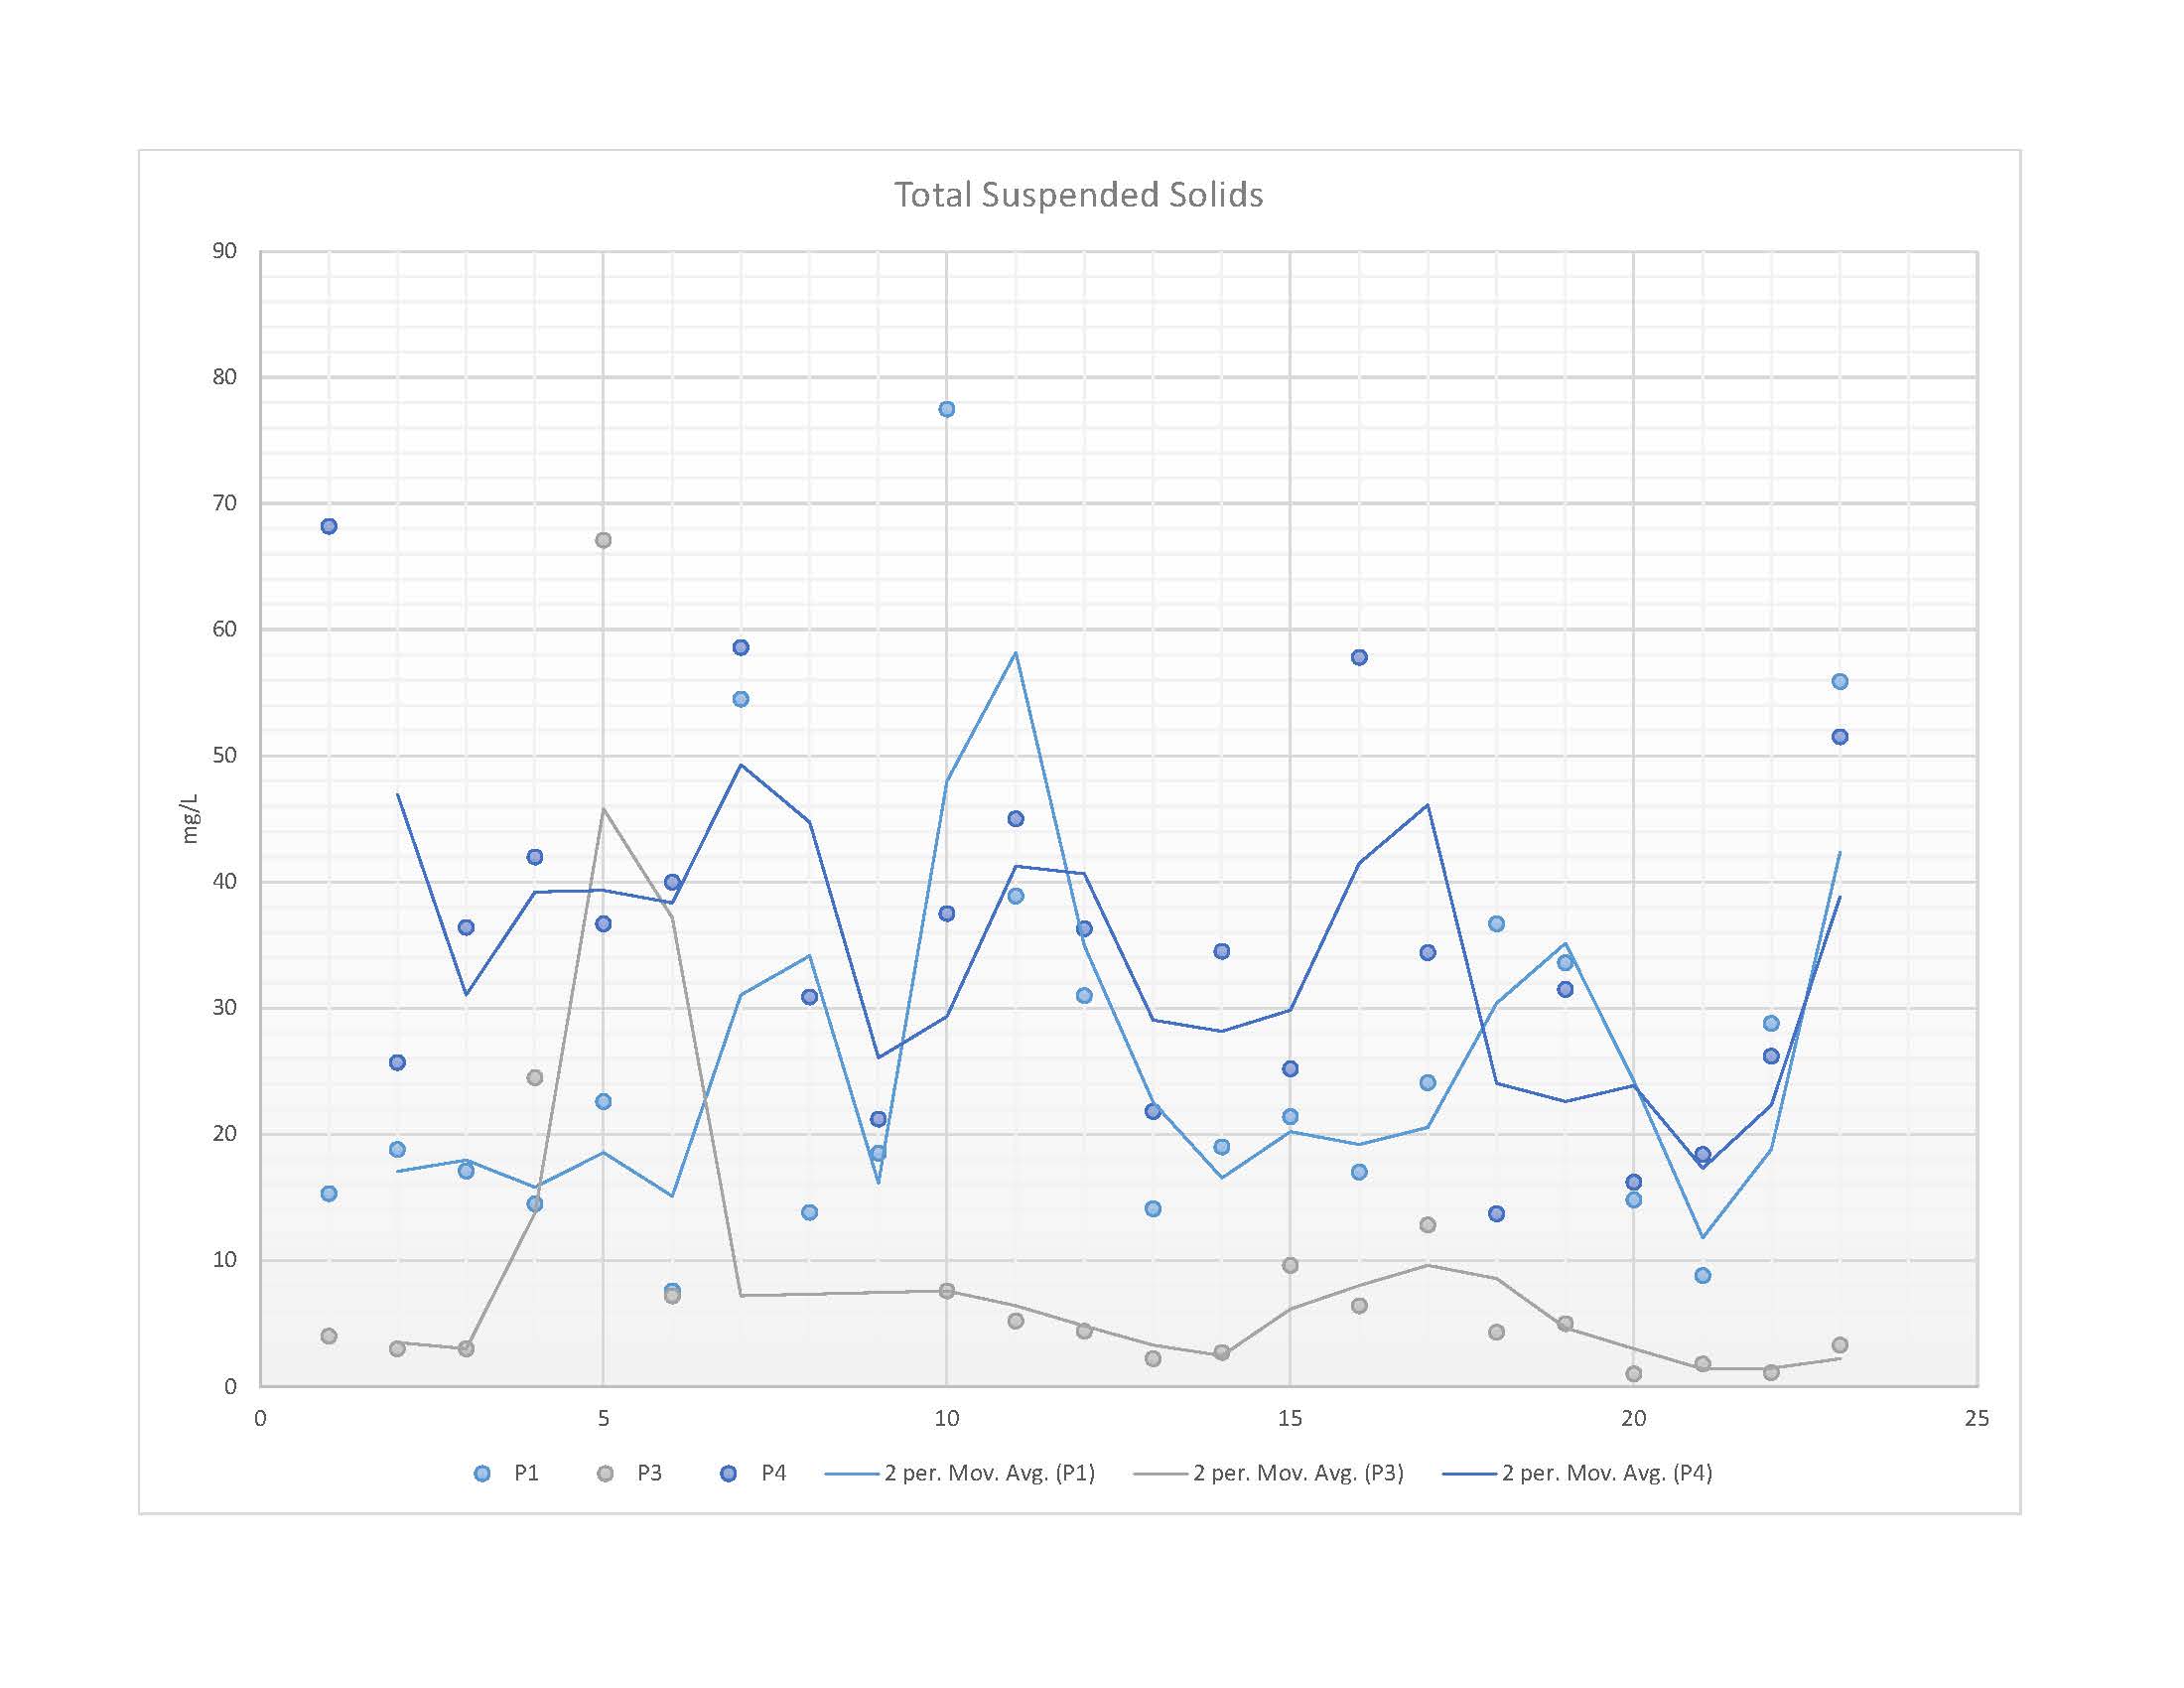
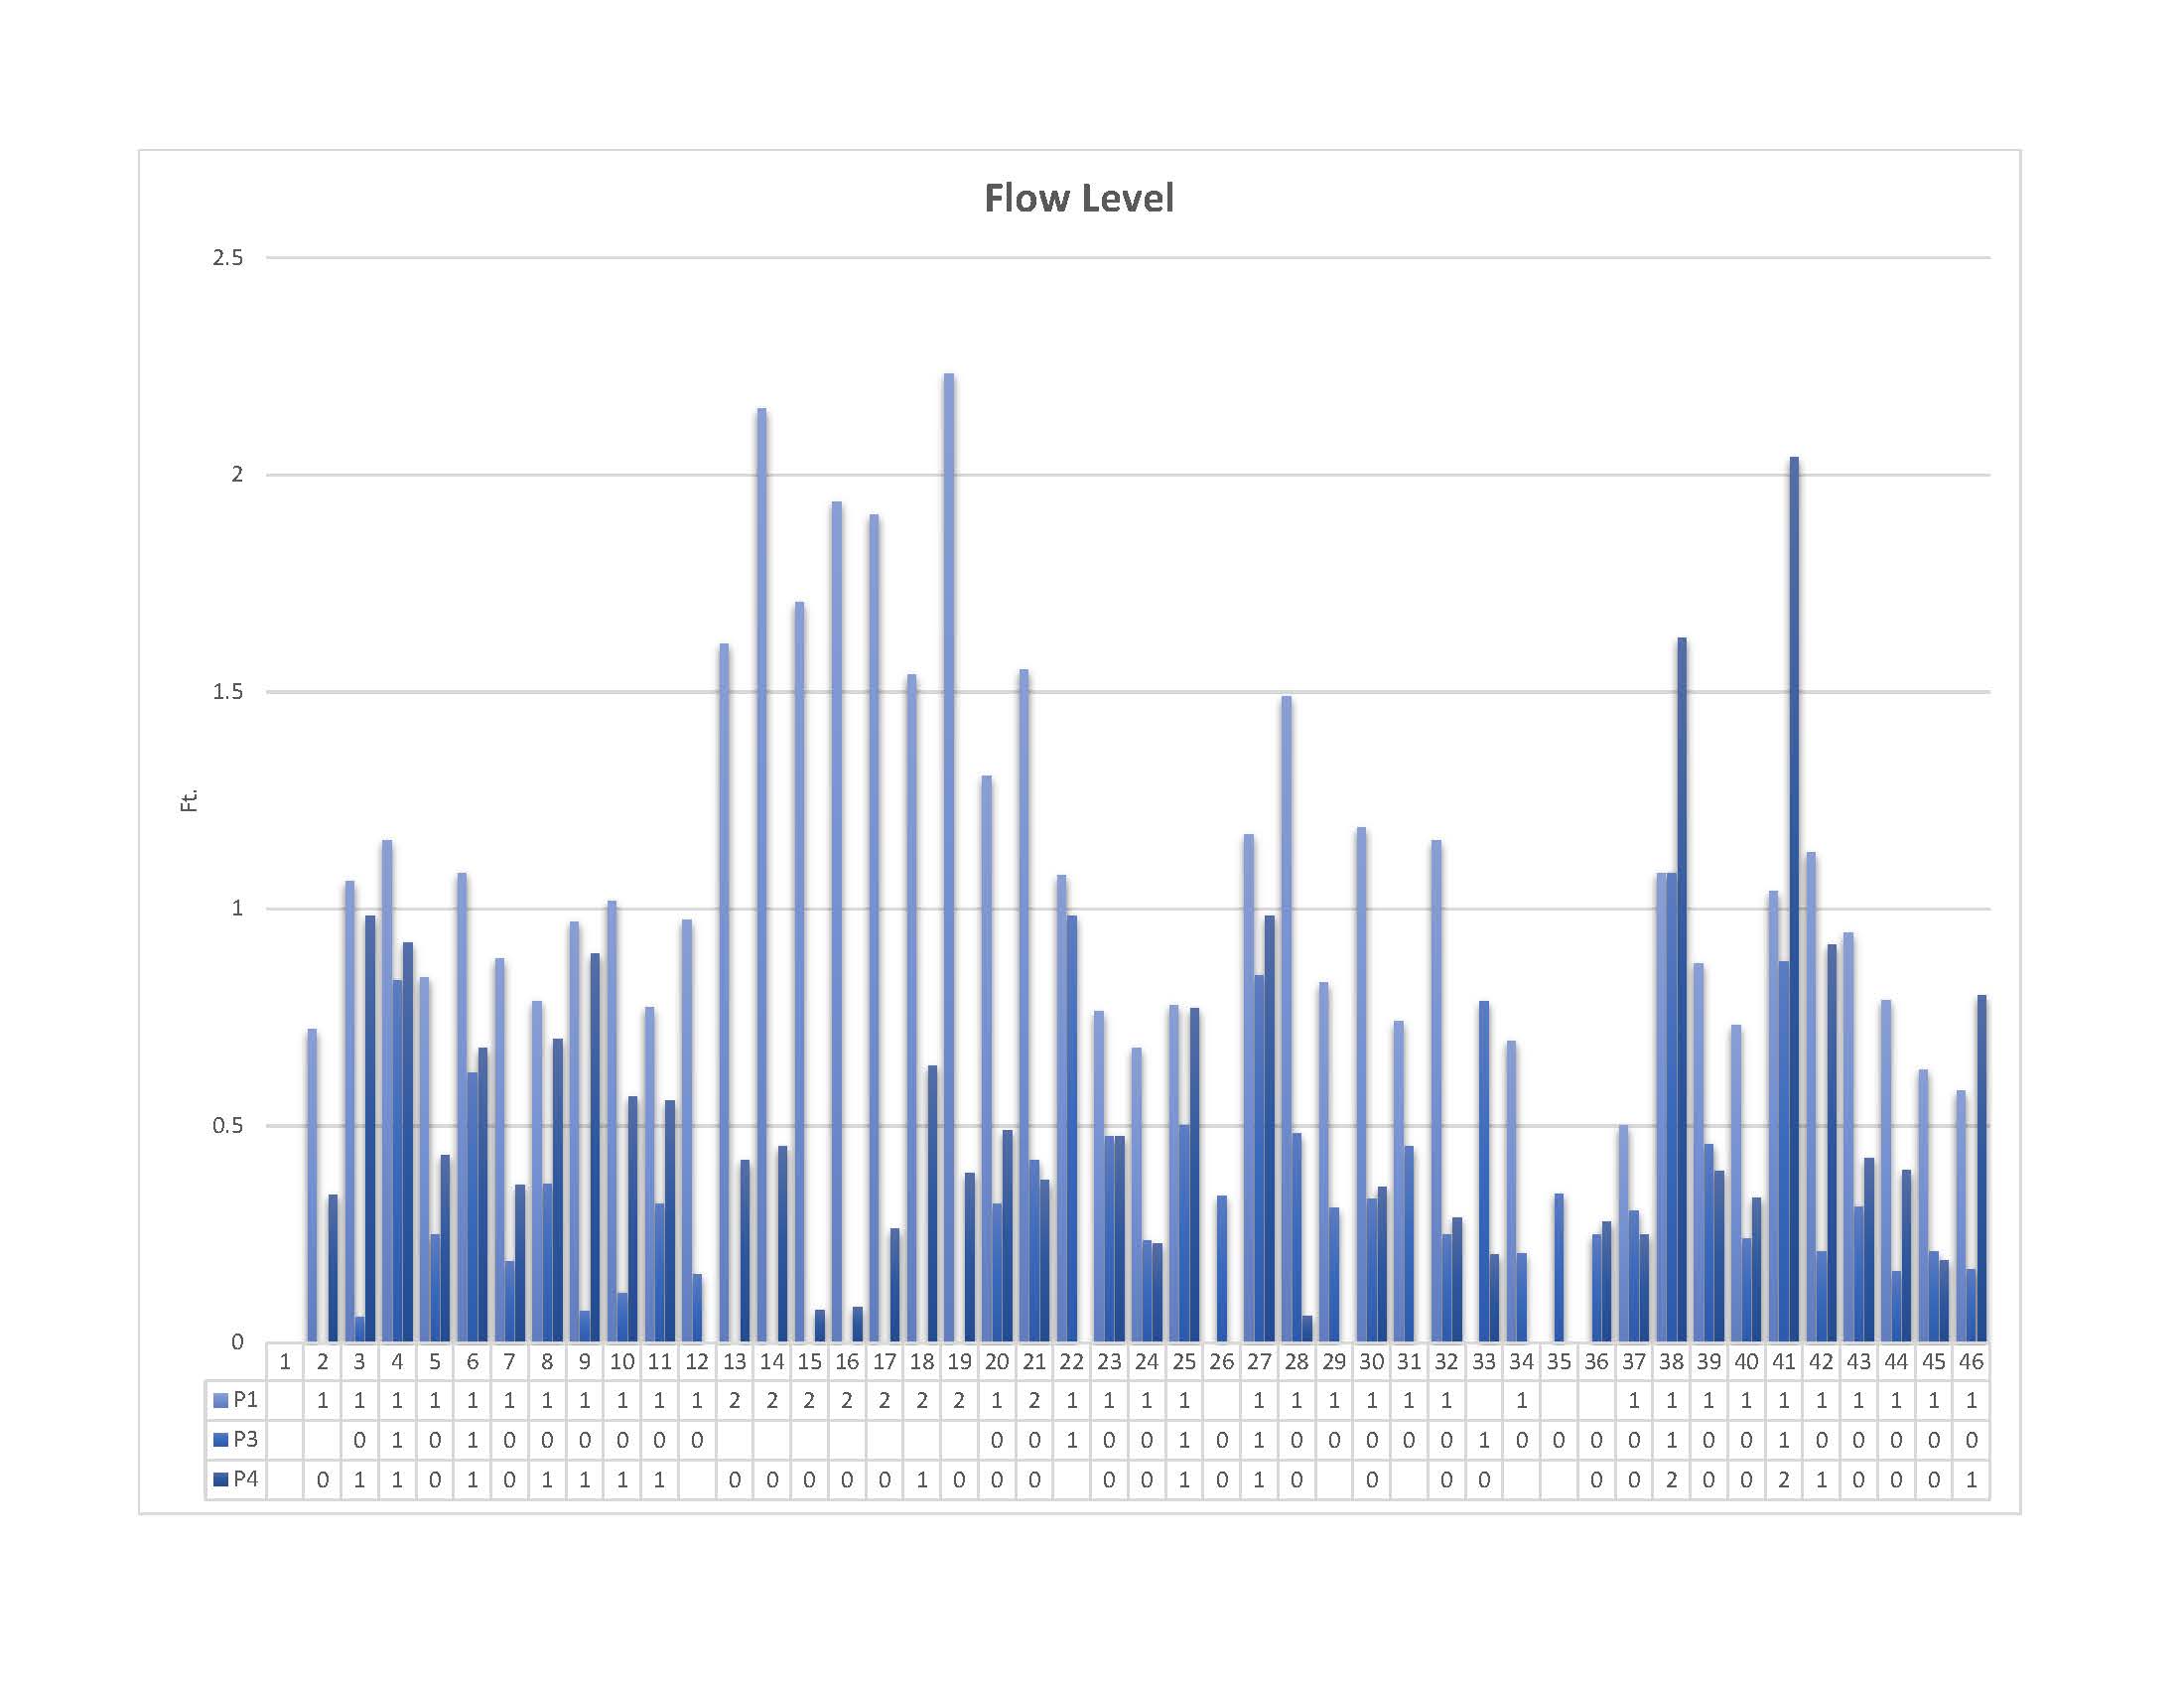
Things to consider: Data suspected to be inaccurate was left out of the graph for both the ammonium and dissolved oxygen charts. Trendlines for phase 3 stagnated for three sampling cycles as there was no flow source to sample from at the site. A new probe for the nitrogen content of ammonium was acquired on 9/6/2023 and future sampling, especially for site 4, reflects a lower-value stable trend. Most sample data represents that from collected water rather than probing directly into the water source. Flow data and rainfall data contain flawed values from technical failure. A meter stick was used for comparison and replaced values in the field data report that was majorly inconsistent.
Documents
CMP 23-020-005-D599 QAPP | Whitepaper Final
THIS PROJECT WAS FUNDED “IN PART” BY A TEXAS COASTAL MANAGEMENT PROGRAM GRANT APPROVED BY THE TEXAS LAND COMMISIONER, PROVIDING FINANCIAL ASSISTANCE UNDER THE COASTAL ZONE MANAGEMENT ACT OF 1972, AS AMENDED, AWARDED BY THE NATIONAL OCEANIC AND ATMOSPHERIC ADMINISTRATION (NOAA), OFFICE FOR COASTAL MANAGEMENT, PURSUANT TO NOAA AWARD NO. NA22NOS4190148
Previous Sampling Archive:
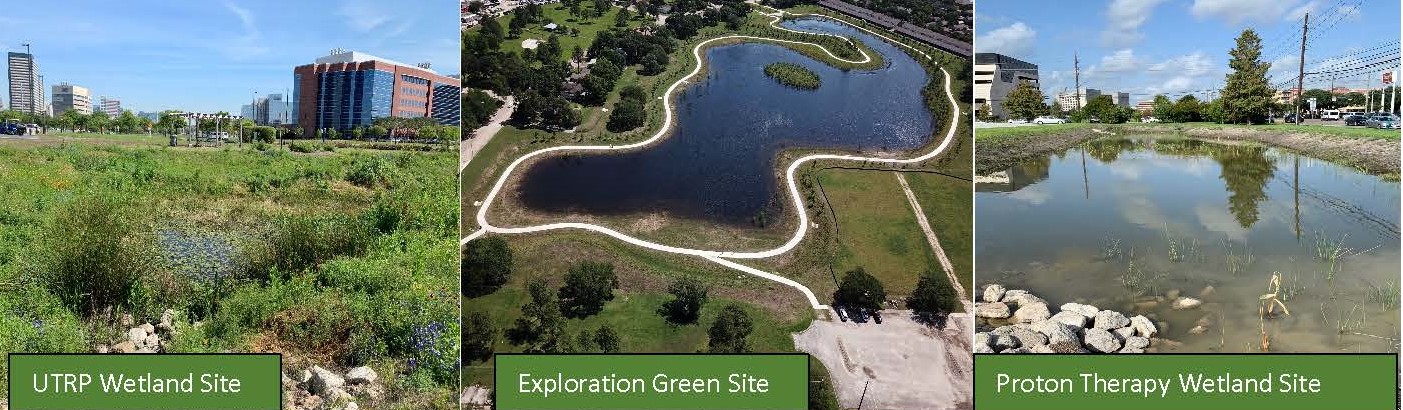
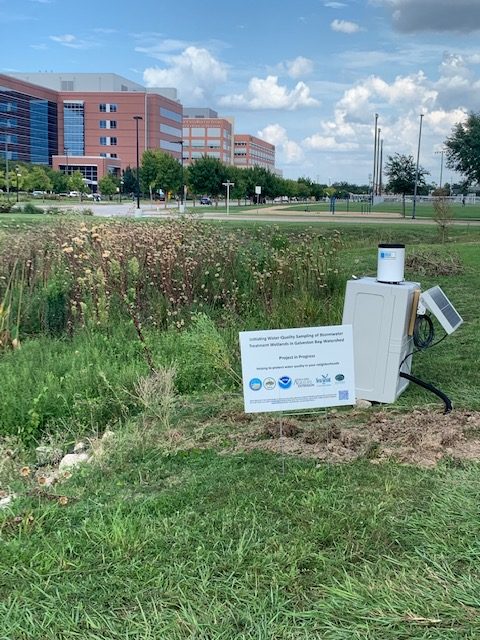
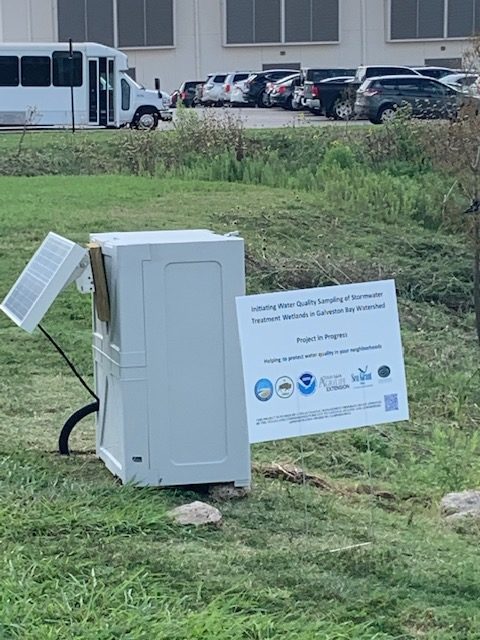
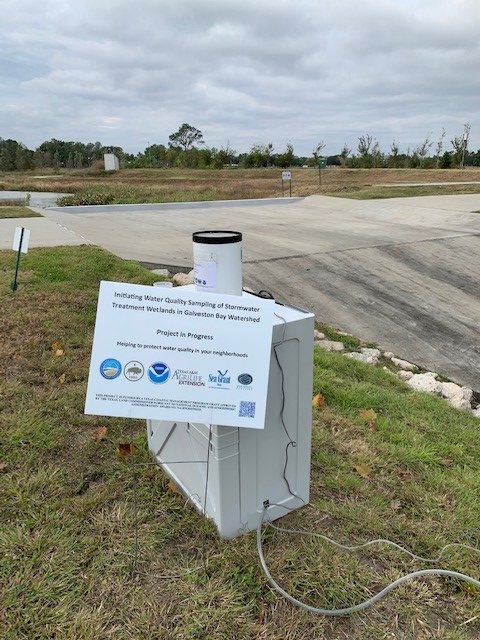
TCWP AgriLife is developing a water quality monitoring protocol to sample three stormwater wetland sites in the Galveston Bay Area.
Sampler Site 101
Sampler Site 102
Location #1: MD Anderson University of Texas Research Park (UTRP) stormwater wetland on the UT MD Anderson Cancer Center’s South Campus: sampling occurred from September 5, 2019 to February 5, 2020.
Graph 1.1 UTRP Rainfall Rainfall data from September 2019- February 2020 At UTRP Site
Graph 1.2 UTRP Flow Level Comparison Flow level data from Inflow 101 (blue) compared to flow levels from the Outflow 102 (red)
Table 1.1: Field Reporting Data for MDA UTRP location
| MDA UTRP Wetland | Rainfall Amount (inches/hr) | Air Temp.
(°C) |
H2O Temp. (°C) | DO (mg/ L) | Specific Conductivity (µS/cm) | pH | ||||||||
| Sampling Events | Inflow | Outflow | Outflow Follow up | Inflow | Outflow | Outflow Follow up | Inflow | Outflow | Outflow Follow up | Inflow | Outflow | Outflow Follow up | ||
| 9/27/2019 | 0.46 | 29 | 28.5 | 27.2 | NA | 7.7 | 5.9 | NA | 112 | 128.9 | NA | 10.64* | 10.88* | NA |
| 10/21/2019 | UNK | 23 | NA | 23.1 | NA | NA | 6.2 | NA | NA | 139 | NA | NA | 10.39* | NA |
| 10/25/2019 | UNK | 11 | NA | 16.8 | NA | NA | 7.9 | NA | NA | 90.2 | NA | NA | 8.6* | NA |
| 11/7/2019 | 0.11 | 19 | 19.5 | 18.9 | – | 9.6 | 8.2 | – | 61.9 | 64.7 | – | 10.48* | 8.5* | – |
| 11/8/2019 | 0.00 | 17 | – | – | 14.2 | – | – | 10.3 | – | – | 275.3 | – | – | 16.29* |
| 12/10/2019 | 0.03 | 11 | 15 | 14.1 | – | 10.3 | 8.8 | – | 133.4 | 149.9 | – | 9.88* | 8.51* | – |
| 12/11/2019 | 0.00 | 12 | – | – | 13 | – | – | 7.4 | – | – | 181.8 | – | – | 16.33* |
| 1/9/2020 | 0.02 | 23 | 20.2 | NA | NA | 8.2 | NA | NA | 260.4 | NA | NA | 7.47 | NA | NA |
| 1/11/2020 | 0.13 | 16 | 17.7 | 16.9 | NA | 9.5 | 9.2 | NA | 80.6 | 73.4 | NA | 8.04 | 7.22 | NA |
| 1/13/2020 | 0.01 | 17 | 14.6 | 15 | NA | 11.4 | 12.4 | NA | 140 | 147.8 | NA | 7.71 | 7.08 | NA |
| 1/28/2020 | 0.02 | 15 | 16.5 | 16.1 | – | 10.4 | 9.9 | – | 80.8 | 146 | – | 7.99 | 7.17 | – |
| 1/29/2020 | 0.00 | 13 | – | – | 15.1 | – | – | 13.6 | – | – | 165.9 | – | – | 7.21 |
| 2/6/2020 | 0.01 | 5 | 7.4 | 7.6 | – | 13.9 | 14.0 | – | 86.3 | 212.2 | – | 7.35 | 7.47 | – |
| 2/7/2020 | 0.00 | 11 | – | – | 8.4 | – | – | 9.6 | – | – | 205.8 | – | – | 7.13 |
NA stands for Not Available meaning there was no data collected for that site on that date.
-Signify that the follow up data was collected on another date 24 hrs. after the initial rainfall event (not all samples have follow up data available)
* designate samples where the YSI pH meter was not recording correctly therefore pH is out of range and not to be used in analysis.
Table 1.2: Lab Results reported for MDA UTRP location
| MDA UTRP Wetland | Location | Sampling Events ID | Nitrogen (mg/L) | Ammonia (mg/L) | TSS (mg/L) | E. coli (mpn/100ml) | Total Phosphate (mg/L) | Arsenic (mg/L) | Barium (mg/L) | Cadmium (mg/L) | Chromium (mg/L) | Lead (mg/L) | Mercury (mg/L) | Selenium (mg/L) | Silver (mg/L) | TPH (mg/L) |
| Reporting Limit | 0.02 | 0.1 | 1 | 10 | 0.06 | 0.0005 | 0.003 | 0.001 | 0.003 | 0.0005 | 0.0002 | 0.005 | 0.0005 | 4.9-5 | ||
| 9/27/2019 | Inflow | UTRP 101-1 | 0.19 | <0.1 | 2.9 | <10 | <1.00 | 0.00137 | 0.0114 | <0.001 | <0.003 | <0.0005 | <0.0002 | <0.005 | <0.0005 | <4.98339 |
| Outflow | UTRP 102-1 | 0.38 | <0.1 | 2.4 | 2600 | <1.00 | 0.000777 | 0.0312 | <0.001 | <0.003 | <0.0005 | <0.0002 | <0.005 | <0.0005 | <4.901961 | |
| 10/21/2019 | Exta | UTRP 102-2 | 0.15 | <0.1 | 2.4 | 350 | 0.347 | |||||||||
| 11/7/2019 | Inflow | UTRP 101-2 | 0.24 | <0.1 | 1.8 | 31 | <0.02 | <0.0005 | 0.0136 | <0.001 | <0.003 | 0.00142 | <0.0002 | <0.005 | <0.0005 | <4.95 |
| Outflow | UTRP 102-3 | 0.08 | 4.1 | 3.5 | 110 | 0.0471 | <0.0005 | 0.019 | <0.001 | <0.003 | 0.000643 | <0.0002 | <0.005 | <0.0005 | <4.92*corrected | |
| 11/8/2019 | Follow up | UTRP 102-4 | <0.02 | 0.8 | 2.3 | 24 | 0.0258 | |||||||||
| 12/10/2019 | Inflow | UTRP 101-3 | 0.77 | 0.1 | 12.1 | 10 | <0.06 | 0.00151 | 0.0237 | <0.001 | <0.003 | 0.00131 | <0.0002 | <0.005 | <0.0005 | <5.0 |
| Outflow | UTRP 102-5 | 0.17 | 0.2 | 3.2 | 906 | <0.06 | 0.000686 | 0.0371 | <0.001 | <0.003 | <0.0005 | <0.0002 | <0.005 | <0.0005 | <5.0 | |
| 12/11/2019 | Follow up | UTRP 102-6 | 0.02 | 0.1 | 15.8 | 121 | <0.06 | |||||||||
| 1/11/2020 | inflow | UTRP 101-4 | 0.21 | 0.2 | 1.2 | 63 | <0.06 | 0.000895 | 0.00811 | <0.001 | <0.003 | <0.0005 | <0.0002 | <0.005 | <0.0005 | <5.0 |
| outflow | UTRP 102-7 | 0.08 | <0.1 | 2.6 | 323 | <0.06 | <0.0005 | 0.0161 | <0.001 | <0.003 | <0.0005 | <0.0002 | <0.005 | <0.0005 | <5.0 | |
| 1/13/2020 | Inflow | UTRP 101-5 | 0.56 | <0.1 | 8.4 | 85 | <0.06 | |||||||||
| outflow | UTRP 102-8 | 0.11 | 0.5 | 4 | 10 | <0.06 | ||||||||||
| 1/28/2020 | Inflow | UTRP 101-6 | 0.48 | 0.1 | 3 | <10 | <0.06 | |||||||||
| outflow | UTRP 102-9 | 0.09 | <0.01 | 2.3 | 63 | <0.06 | ||||||||||
| 1/29/2020 | Follow up | UTRP 102-10 | 0.04 | 0.3 | 6.8 | <10 | <0.06 | |||||||||
| 2/6/2020 | Inflow | UTRP 101-7 | 0.44 | 0.2 | 12.2 | <10 | <0.06 | |||||||||
| Outflow | UTRP 102-11 | 0.02 | <0.1 | 8.4 | 473 | <0.06 | ||||||||||
| 2/7/2020 | Follow up | UTRP 102-12 | <0.02 | 0.5 | 7.9 | 10 | <0.06 |
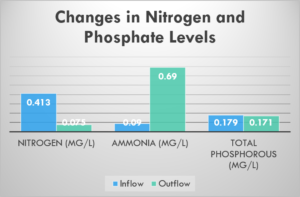
Table 1.3: Initial Analysis of data from MDA UTRP location
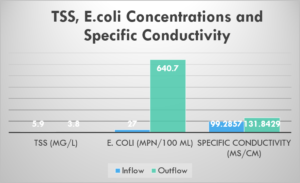
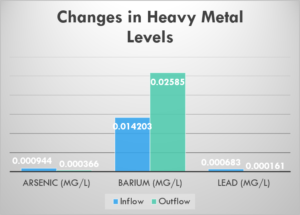
| Nitrogen (mg/L) | Ammonia (mg/L) | TSS (mg/L) | E. coli (mpn/100ml) | Total Phosphate (mg/L) | Arsenic (mg/L) | Barium (mg/L) | Cadmium (mg/L) | Chromium (mg/L) | Lead (mg/L) | Mercury (mg/L) | Selenium (mg/L) | Silver (mg/L) | TPH (mg/L) | ||
| Inflow Mean Values | 0.413 | 0.09 | 5.9 | 27.0 | 0.179 | 0.000944 | 0.014203 | NR | NR | 0.000683 | NR | NR | NR | NR | |
| Outflow Mean Values | 0.133 | 0.69 | 3.8 | 640.7 | 0.171 | 0.000366 | 0.02585 | NR | NR | 0.000161 | NR | NR | NR | NR | |
| Inflow Mean Values | Subset | 0.483 | 0.10 | 7.3 | 10.3 | 0.040 | |||||||||
| Outflow Mean Values | Subset | 0.090 | 1.08 | 4.4 | 388.0 | 0.049 | |||||||||
| Follow Up Mean Values | Subset | 0.020 | 0.10 | 5.7 | 38.8 | 0.044 |
* NR stands for not reported there were no sample values at or above the reporting limit for these metal parameters.
UTRP Lab Reports and Field Data: UTRP101-1, UTRP102-1, UTRP 101-2, UTRP 102-2, UTRP 102-3, UTRP 102-4, UTRP 101-3, UTRP 102-5, UTRP 101-4, UTRP 102-6, UTRP 102-7, UTRP 101-5, UTRP 102-8, UTRP 102-9, UTRP 101-6, UTRP 102-10, UTRP 102-11, UTRP 101-7, UTRP 102-12, Field Data Recording Sheet- UTRP
Exploration Green Sampler Site 202
Location #2: Exploration Green Conservation and Recreation Area , Phase 1(EG) in the 1800 block of Reseda Dr. Houston TX, 77058: Sampling began on December 10, 2019 was completed on June 24, 2020. Gaps in sampling data occur due to equipment malfunction, replacement of battery power supply and COVID 19 stay home work safe restrictions to site visits.
Graph 2.2 EG Rainfall Rainfall data from December 2019- June 2020
Graph 2.3 EG Outfall flow level Flow level data from EG Phase 1 Outfall from Dec.2019-June 2020
Table 2.1 Field Reporting Data from EG location
| Exploration Green Wetland | Air Temp.
(°C) |
H2O Temp.
(°C) |
DO (mg/ L) | pH | Specific Conductivity (µS/cm) | ||||||||
| Sampling Events | Inflow | Outflow | Outflow Follow up | Inflow | Outflow | Outflow Follow up | Inflow | Outflow | Outflow Follow up | Inflow | Outflow | Outflow Follow up | |
| 12/10/19 | 11 | 17.5 | 16.0 | 15.1 | 8.4 | 8.3 | 8.1 | 4.6 | 6.9 | 9.52 | 314.4 | 224.4 | 276.2 |
| 1/11/20 | 13 | 17.1 | 18.3 | N/A | 8.4 | 8.2 | N/A | 7.38 | 7.76 | N/A | 237.0 | 326.3 | N/A |
| 1/13/20 | 16 | 16.5 | 16.9 | N/A | 8.6 | 8.6 | N/A | 7.36 | 7.75 | N/A | 264.9 | 297.8 | N/A |
| 1/28/20 | 18 | 17 | 15.6 | 14.4 | 11.6 | 9.5 | 7.8 | 7.99 | 6.99 | 7.42 | 328.4 | 318.2 | 306.9 |
| 4/5/20 | 22 | 23.9 | 20 | N/A | 7.3 | 8.2 | N/A | 7.69 | 7.21 | N/A | 405.9 | 135.9 | N/A |
| 4/20/20 | 16 | 22.7 | 23.1 | N/A | 6.6 | 5.4 | N/A | 8.35 | 7.41 | N/A | 428.5 | 422.6 | N/A |
| 4/29/20 | 20 | 25 | 24.1 | N/A | 7.5 | 7.9 | N/A | 8.12 | 7.71 | N/A | 434.9 | 353.4 | N/A |
| 5/6/20 | 28 | 26.5 | 26.5 | N/A | 6.3 | 7.5 | N/A | 8.36 | 7.61 | N/A | 464.2 | 419.8 | N/A |
| 5/13/20 | 22 | 26.8 | 25.1 | N/A | 7.3 | 6.3 | N/A | 7.95 | 7.58 | N/A | 469.6 | 455.3 | N/A |
| 6/24/20 | 29 | 28.3 | 29.9 | N/A | 8.0 | 9.3 | N/A | 8.03 | 8.04 | N/A | 279.6 | 257.4 | N/A |
Table 2.2 Lab Results Reported for EG location
| Exploration Green Wetland | Location | Sampling Events ID | Nitrate + Nitrite as N | Ammonia
as N |
TSS | E. coli | Total Phosphorous | |
| Reporting Limit | 0.02 mg/L | 0.1 mg/L | 1.0 mg/L | 10 mpn/100 mL | 0.06 mg/L | |||
| Date | ||||||||
| 12/10/19 | Inflow | EG 201-1 | 0.42 | 0.1 | 139 | 4880 | 0.118 | |
| 12/10/19 | Outflow | EG 202-1 | 0.42 | 0.2 | 24.0 | 24200 | 0.141 | |
| 12/12/19 | Follow up | EG 202-2 | 0.37 | 0.5 | 26.0 | <10 | 0.101 | |
| 1/11/20 | Inflow | EG 201-2 | 0.26 | 0.1 | 20.6 | 4110 | 0.153 | |
| 1/11/20 | Outflow | EG 202-3 | 0.23 | 0.1 | 23.2 | 24200 | 0.118 | |
| 1/13/20 | Inflow | EG 201-3 | 0.23 | <0.1 | 24.4 | 4610 | 0.149 | |
| 1/13/20 | Outflow | EG 202-4 | 0.2 | 0.3 | 15.6 | 2610 | 0.0624 | |
| 1/28/20 | Inflow | EG 201-4 | 0.46 | <0.1 | 31.9 | 2280 | 0.156 | |
| 1/28/20 | Outflow | EG 202-5 | 0.40 | 0.1 | 19.1 | 426 | 0.126 | |
| 4/29/20 | Inflow | EG- 201-5 | 1.87 | <0.01 | 34.0 | 12000 | 0.149 | |
| 4/29/20 | Outflow | EG-202-7 | 2.73 | 0.2 | 23.2 | 3260 | 0.141 | |
| 05/06/20 | inflow | EG 201-6 | 0.05 | 0.1 | 54.0 | 24200 | 0.150 | |
| 05/06/20 | outflow | EG 202-8 | 0.02 | 0.1 | 15.6 | 638 | 0.163 | |
| 05/13/20 | Inflow | EG 201-7 | 0.03 | <0.1 | 66.4 | 8660 | 0.113 | |
| 05/13/20 | Outflow | EG 202-9 | 0.05 | <0.1 | 18.0 | 771 | 0.142 | |
| 06/24/20 | Inflow | EG 201-8 | 0.03 | <0.1 | 31.2 | 9210 | 0.140 | |
| 06/24/20 | Outflow | EG 202-10 | 0.02 | <0.1 | 20.0 | 6130 | 0.158 | |
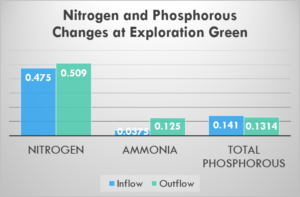
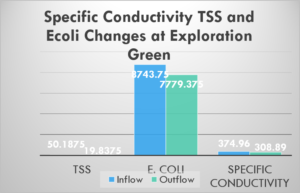
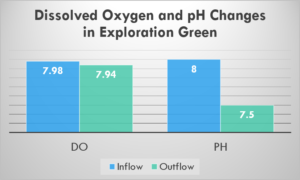
Table 2.3: Initial Analysis of data from Exploration Green site locations
| Mean Values | Nitrogen | Ammonia | TSS | E. Coli | Total Phosphorous | DO | Specific Conductivity | pH |
| Inflow | 0.475 | 0.0375 | 50.2 | 8743.8 | 0.141 | 7.98 | 374.96 | 8 |
| Outflow | 0.509 | 0.125 | 19.8 | 7779.4 | 0.1314 | 7.94 | 308.89 | 7.5 |
| Difference | -0.034 | -0.0875 | 30.4 | 964.38 | 0.0096 | 0.04 | 66.07 | 0.5 |
Exploration Green Lab Reports and Field Data: EG 201-1, EG 201-2, EG 201-3, EG 201-4, EG201-5, Eg 201-6, EG 201-7 EG 201-8 EG 202-1, EG 202-2, EG 202-3, EG 202-4, EG 202-5, EG 202-6, EG202-, EG 202-8, EG 202-9, EG 202-10, Field Data Recording Sheet-EG, Field Data Recording Sheet-EG 2, Field Data Recording Sheet-EG 3, Field Data Recording Sheet-EG 4, EG FIELDDATA-EVENT8
Exploration Green Site 203
Location #4: this location to be added March 2023 samples the outfall in Phase 3 of Exploration Green located between El Dorado Blvd. and Space Center Blvd. in the Clear Lake area of Houston, TX.
Check back for updates starting in April 2023…
Exploration Green Site 204
Location #5 this location to be added March 2023 samples from the outfall location between Phases 4 and 5 of Exploration Green located near the 1700 block of Neptune Ln in the Clear Lake area of Houston, TX.
Check back for updates starting in April 2023…
PTWB Site 301
PTWB Site 302
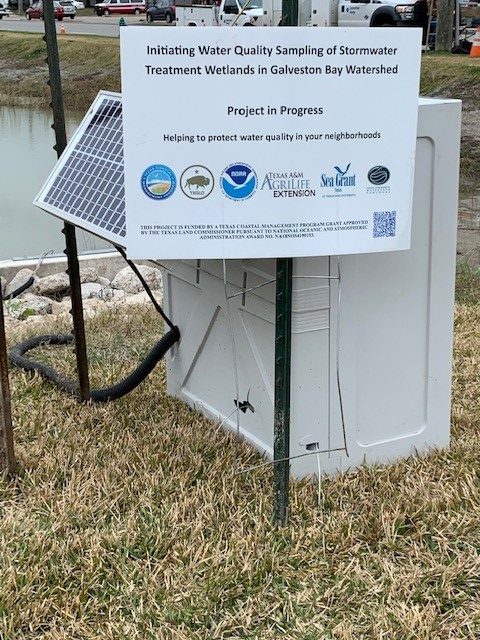
Location #3: Proton Therapy Parking Lot Expansion Wetland Basin (PTWB) at UT MD Anderson Cancer Center’s South Campus at the corner of Fannin and Old Spanish Trail Houston TX: Sampling began February 19th and completed July 22, 2020. Sampling was suspended from March 16- April 26 2020 due to COVID 19 stay home work safe orders during the global pandemic. This site only collected the minimum 5 samples compared to 8 at each of the other locations.
Graph 3.1 PTWB Rainfall Rainfall at PTWB site from March – July 2020
Graph 3.2 PTWB Flow Level Comparison Flow Level comparison from Inflow 301 (blue) compared to Outflow 302 (red) for the period from March – July 2020 (pending)
Table 3.1 Field Reporting Data from PTWB location
| PTWB Wetland | Rainfall Amount (inches/hr) | Air Temp. (°C) | H2O Temp. (°C) | DO (mg/ L) | Specific Conductivity (µS/cm) | pH | ||||
| Sampling Event | Inflow | Outflow | Inflow | Outflow | Inflow | Outflow | Inflow | Outflow | ||
| 4/28/2020 | 0.03 | 31 | 25.7 | N/A | 7.9 | N/A | 312.2 | N/A | 8.75 | N/A |
| 4/29/2020 | 0.08 | 21 | 20.2 | 21 | 8.8 | 9.2 | 128.5 | 133.1 | 8.33 | 8.33 |
| 5/6/2020 | 0.04 | 19 | 24.5 | 24.3 | 7.4 | 8.3 | 126.1 | 109.2 | 8.61 | 8.56 |
| 5/15/2020 | 0.07 | 22 | 24.8 | 25.1 | 8.2 | 8.2 | 89.9 | 101.9 | 8.49 | 8.83 |
| 6/22/2020 | 0.11 | 22 | 25.3 | 26.5 | 6.9 | 6 | 102 | 119.1 | 8.51 | 7.74 |
| 7/22/2020 | 0.03 | 27.7 | 30.1 | 29.6 | 6.8 | 8.4 | 260.1 | 206.4 | 8.76 | 8.67 |
Table 3.2 Lab Report Results for PTWB location
| MDA PTWB Wetland | Location | Sampling Events ID | Nitrogen (mg/L) | Ammonia (mg/L) | TSS (mg/L) | E. coli (mpn/100ml) | Total Phosphate (mg/L) | Arsenic (mg/L) | Barium (mg/L) | Cadmium (mg/L) | Chromium (mg/L) | Lead (mg/L) | Mercury (mg/L) | Selenium (mg/L) | Silver (mg/L) | TPH (mg/L) |
| Reporting Limit | 0.02 | 0.1 | 1 | 10 | 0.06 | 0.0005 | 0.003 | 0.001 | 0.003 | 0.0005 | 0.0002 | 0.005 | 0.0005 | 5 | ||
| Date | ||||||||||||||||
| 4/29/2020 | Inflow | PTWB 301-1 | 1.17 | 0.1 | 7.3 | 161 | <0.06 | |||||||||
| 4/29/2020 | Outflow | PTWB 302-1 | 2.26 | <0.1 | 51.2 | 9800 | <0.06 | |||||||||
| 5/6/2020 | Inflow | PTWB 301-2 | 11 | 0.2 | 12 | 733 | <0.06 | 0.00171 | 0.0191 | <0.001 | 0.00529 | <0.0005 | <0.0002 | <0.005 | <0.0005 | <5.0 |
| 5/6/2020 | Outflow | PTWB 302-2 | 0.58 | 0.1 | 24.8 | 1920 | <0.06 | 0.00159 | 0.0274 | <0.001 | 0.00451 | 0.0008 | <0.0002 | <0.005 | <0.0005 | <5.0 |
| 5/15/2020 | Inflow | PTWB 301-3 | 0.13 | <0.1 | 16.8 | 1300 | <0.06 | 0.00098 | 0.00996 | <0.001 | 0.00302 | <0.0005 | <0.0002 | <0.005 | <0.0005 | <5.0 |
| 5/15/2020 | Outflow | PTWB 302-3 | 0.11 | <0.1 | 4.5 | 4840 | <0.06 | 0.00133 | 0.0239 | <0.001 | 0.00482 | 0.000774 | <0.0002 | <0.005 | <0.0005 | <5.0 |
| 6/22/2020 | inflow | PTWB 301-4 | 0.12 | <0.1 | 1.4 | 20 | <0.06 | 0.000517 | 0.00589 | <0.001 | <0.003 | <0.0005 | <0.0002 | <0.005 | <0.0005 | <5.0 |
| 6/22/2020 | outflow | PTWB 302-4 | 0.24 | <0.1 | 3.6 | 10 | <0.06 | 0.00152 | 0.0255 | <0.001 | 0.00370 | <0.0005 | <0.0002 | <0.005 | <0.0005 | <5.0 |
| 7/22/2020 | Inflow | PTWB 301-5 | 0.13 | 0.1 | 33.2 | 10 | <0.06 | 0.00316 | 0.0560 | <0.001 | <0.003 | <0.0005 | <0.0002 | <0.005 | <0.0005 | <5.0 |
| 7/22/2020 | outflow | PTWB 302-5 | 0.02 | <0.1 | 3.9 | <10 | <0.06 | 0.00213 | 0.0495 | <0.001 | 0.00334 | <0.0005 | <0.0002 | <0.005 | <0.0005 | <5.0 |
Table 3.3: Initial Analysis of data from Proton Therapy Wetland Basin site locations
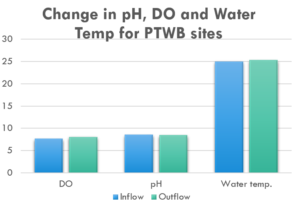
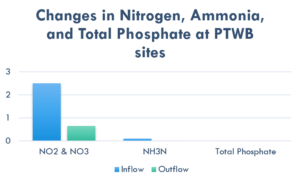
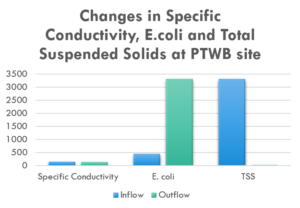
| Mean Values | DO | Specific Conductivity | pH | Water temp. | NO2 & NO3 | NH3N | E. coli | TSS | Total Phosphate | Arsenic | Barium | Chromium | Lead |
| Inflow | 7.62 | 141.32 | 8.54 | 24.98 | 2.51 | 0.1 | 444.8 | 3314 | 0 | 0.00159175 | 0.0227375 | 0.0020775 | 0 |
| Outflow | 8.02 | 133.94 | 8.426 | 25.3 | 0.642 | 0.02 | 3314 | 17.6 | 0 | 0.0016425 | 0.031575 | 0.0040925 | 0.0003935 |
| Difference | -0.29 | 7.38 | 0.114 | -0.32 | 1.87 | 0.08 | -2869 | 3296 | 0 | -0.00005075 | -0.0088375 | -0.00202 | -0.000394 |
- PTWB Lab Reports and Field Data: Field Notes-PTWB1, Field Notes- PTWB-2, Field Notes PTWB-3, PTWB Field Notes Event 5, PTWB 301-1, PTWB 301-2, PTWB 301-3, PTWB 301-4, PTWB 301-5 PTWB 302-1, PTWB 302-2, PTWB302-3, PTWB 302-4, PTWB 302-5
Initial Results for each parameter are in the following tables:
DO (mg/ L):
| MDA UTRP Wetland | Exploration Green Phase 1 | MDA Proton Therapy Wetland | ||||||
| Sampling Events | 101 Inflow | 102 Outflow | 102 Follow up | 201 Inflow | 202 Outflow | 202 Follow up | 301 Inflow | 302 Outflow |
| 9/27/2019 | 7.7 | 5.9 | ||||||
| 11/7/2019 | 9.6 | 8.2 | 10.3 | |||||
| 12/10/2019 | 10.3 | 8.8 | 7.4 | 8.4 | 8.3 | 8.1 | ||
| 1/9/2020 | 8.2 | 9.2 | ||||||
| 1/11/2020 | 9.5 | 12.4 | 8.4 | 8.2 | ||||
| 1/13/2020 | 11.4 | 9.9 | 8.6 | 8.6 | ||||
| 1/28/2020 | 10.4 | 9.9 | 13.6 | 11.6 | 9.5 | 7.8 | ||
| 2/6/2020 | 13.9 | 14 | 9.6 | |||||
| 4/5/2020 | 7.3 | 8.2 | ||||||
| 4/20/2020 | 6.6 | 5.4 | ||||||
| 4/29/2020 | 7.5 | 7.9 | 8.8 | 9.2 | ||||
| 5/6/2020 | 6.3 | 7.5 | 7.4 | 8.3 | ||||
| 5/13/2020 | 7.3 | 6.3 | ||||||
| 5/15/2020 | 8.2 | 8.2 | ||||||
| 6/22/2020 | 6.9 | 6 | ||||||
| 6/24/2020 | 8 | 9.3 | ||||||
| 7/22/2020 | 6.8 | 8.4 | ||||||
Analysis of DO:
| Inflow | Outflow | difference | |
| average | 9.0793103 | 8.772414 | 0.306897 |
| t-test | 0.3485493 | ||
| t-crit | 2.048 |
Specific Conductivity (µS/cm):
| MDA UTRP Wetland | Exploration Green Phase 1 | MDA Proton Therapy Wetland | ||||||
| Sampling Events | Inflow | Outflow | follow up | Inflow | Outflow | follow up | Inflow | Outflow |
| 9/27/2019 | 112 | 128.9 | ||||||
| 11/7/2019 | 61.9 | 64.7 | 275.3 | |||||
| 11/8/2019 | ||||||||
| 12/10/2019 | 133.4 | 149.9 | 181.8 | 314.4 | 224.4 | 276.2 | ||
| 1/11/2020 | 80.6 | 73.4 | 326.3 | 237 | ||||
| 1/13/2020 | 140 | 147.8 | 297.8 | 264.9 | ||||
| 1/28/2020 | 80.8 | 146 | 165.9 | 328.4 | 318.2 | 306.9 | ||
| 2/6/2020 | 86.3 | 212.2 | 205.8 | |||||
| 4/5/2020 | 405.9 | 135.9 | ||||||
| 4/20/2020 | 428.5 | 422.6 | ||||||
| 4/29/2020 | 434.9 | 353.4 | 128.5 | 133.1 | ||||
| 5/6/2020 | 464.2 | 419.8 | 126.1 | 109.2 | ||||
| 5/13/2020 | 469.6 | 455.3 | ||||||
| 5/15/2020 | 89.9 | 101.9 | ||||||
| 6/22/2020 | 102 | 119.1 | ||||||
| 6/24/2020 | 279.6 | 257.4 | ||||||
| 7/22/2020 | 260.1 | 206.4 | ||||||
Analysis of Specific Conductivity:
| inflow | outflow | difference | |
| average | 219.8714 | 217.6214 | 2.25 |
| t-test score | 0.889651 | ||
| t-critical | 2.052 |
pH :
| MDA UTRP Wetland | Exploration Green Phase 1 | MDA Proton Therapy Wetland | ||||||
| Sampling Events | Inflow | Outflow | follow up | Inflow | Outflow | follow up | Inflow | Outflow |
| 9/27/2019 | 10.64* | 10.88* | ||||||
| 11/7/2019 | 10.48* | 8.5* | 16.29* | |||||
| 12/10/2019 | 9.88* | 8.51* | 16.33* | 4.6* | 6.9* | 9.52* | ||
| 1/11/2020 | 8.04 | 7.22 | 7.76 | 7.38 | ||||
| 1/13/2020 | 7.71 | 7.08 | 7.75 | 7.36 | ||||
| 1/28/2020 | 7.99 | 7.17 | 7.21 | 7.99 | 6.99 | 7.42 | ||
| 2/6/2020 | 7.35 | 7.47 | 7.13 | |||||
| 4/5/2020 | 7.69 | 7.21 | ||||||
| 4/20/2020 | 8.35 | 7.41 | ||||||
| 4/29/2020 | 8.12 | 7.71 | 8.33 | 8.33 | ||||
| 5/6/2020 | 8.36 | 7.61 | 8.61 | 8.56 | ||||
| 5/13/2020 | 7.95 | 7.58 | ||||||
| 5/15/2020 | 8.49 | 8.83 | ||||||
| 6/22/2020 | 8.51 | 7.74 | ||||||
| 6/24/2020 | 8.03 | 8.04 | ||||||
| 7/22/2020 | 8.76 | 8.67 | ||||||
*denotes pH readings are out of normal range due to instrument error. These values were not used in the calculations.
Analysis of pH:
| inflow | outflow | difference | |
| average | 8.053333333 | 7.624762 | 0.428571 |
| t-score | 0.00004577348 | ||
| t critical | 2.086 |
TSS: Total Suspended Solids combined for All 3 locations
| TSS | Inflow | Outflow | Difference |
| 2.9 | 2.4 | 0.5 | |
| 1.8 | 3.5 | -1.7 | |
| 12.1 | 3.2 | 8.9 | |
| 1.2 | 2.6 | -1.4 | |
| 8.4 | 4 | 4.4 | |
| 3 | 2.3 | 0.7 | |
| 12.2 | 8.4 | 3.8 | |
| 139 | 24 | 115 | |
| 20.6 | 23.2 | -2.6 | |
| 24.4 | 15.6 | 8.8 | |
| 31.9 | 19.1 | 12.8 | |
| 34 | 23.2 | 10.8 | |
| 54 | 15.6 | 38.4 | |
| 66.4 | 18 | 48.4 | |
| 31.2 | 20 | 11.2 | |
| 7.3 | 51.2 | -43.9 | |
| 12 | 24.8 | -12.8 | |
| 16.8 | 4.5 | 12.3 | |
| 1.4 | 3.6 | -2.2 | |
| 33.2 | 3.9 | 29.3 |
Analysis of TSS:
| TSS: | Inflow | Outflow | Difference |
| sum | 513.8 | 273.1 | 240.7 |
| mean | 25.69 | 13.655 | 12.035 |
| t-test | 0.095284 | ||
| t-crit | 2.093 |
E.Coli data for All three locations
| E. coli | Inflow | Ouflow | Difference |
| 0 | 2600 | -2600 | |
| 31 | 110 | -79 | |
| 10 | 906 | -896 | |
| 63 | 323 | -260 | |
| 85 | 10 | 75 | |
| 0 | 63 | -63 | |
| 0 | 473 | -473 | |
| 4880 | 24200 | -19320 | |
| 4110 | 24200 | -20090 | |
| 4610 | 2610 | 2000 | |
| 2280 | 426 | 1854 | |
| 12000 | 3260 | 8740 | |
| 24200 | 638 | 23562 | |
| 8660 | 771 | 7889 | |
| 9210 | 6130 | 3080 | |
| 161 | 9800 | -9639 | |
| 733 | 1920 | -1187 | |
| 1300 | 4840 | -3540 | |
| 20 | 10 | 10 | |
| 10 | 0 | 10 |
Analysis of E. coli bacteria data
| E. coli | Inflow | Outflow | Difference |
| sum | 72363 | 83290 | -10927 |
| mean | 3618.15 | 4164.5 | -546.35 |
| t-test | 0.792677 | ||
| t-crit | 2.093 | Accept H0: no change | |
Phosphate: Phosphate data for all 3 locations
| Phosphate | Inflow | Outflow | Difference |
| 0 | 0.0471 | -0.0471 | |
| 0.118 | 0.141 | -0.023 | |
| 0.153 | 0.118 | 0.035 | |
| 0.149 | 0.0624 | 0.0866 | |
| 0.156 | 0.126 | 0.03 | |
| 0.149 | 0.141 | 0.008 | |
| 0.15 | 0.163 | -0.013 | |
| 0.113 | 0.142 | -0.029 | |
| 0.14 | 0.158 | -0.018 |
Analysis of Phosphate:
| Phosphate | Inflow | Outflow | Difference |
| sum | 1.128 | 1.0985 | 0.0295 |
| mean | 0.125333 | 0.122056 | 0.0032778 |
| t-test | 0.817973 | ||
| t-crit | 2.306 | Accept H0: no change | |
Ammonia: Ammonia data for all 3 locations
| Ammonia | Inflow | Outflow | Difference |
| 0 | 4.1 | -4.1 | |
| 0.1 | 0.2 | -0.1 | |
| 0.2 | 0 | 0.2 | |
| 0 | 0.5 | -0.5 | |
| 0.1 | 0 | 0.1 | |
| 0.2 | 0 | 0.2 | |
| 0.1 | 0.2 | -0.1 | |
| 0.1 | 0.1 | 0 | |
| 0 | 0.3 | -0.3 | |
| 0 | 0.1 | -0.1 | |
| 0 | 0.2 | -0.2 | |
| 0.1 | 0.1 | 0 | |
| 0.1 | 0 | 0.1 | |
| 0.2 | 0.1 | 0.1 | |
| 0.1 | 0 | 0.1 | |
| 0.1 | 0 | 0.1 |
Analysis of Ammonia:
| Ammonia | Inflow | Outflow | Difference |
| sum | 1.4 | 5.9 | -4.5 |
| mean | 0.0875 | 0.36875 | -0.28125 |
| t-test | 0.294446 | ||
| t-crit | 2.131 | ||
| Accept H0: no change | |||
Nitrogen: Nitrogen data for All 3 locations
| Nitrogen | Inflow | Outflow | Difference |
| 0.19 | 0.38 | -0.19 | |
| 0.24 | 0.08 | 0.16 | |
| 0.77 | 0.17 | 0.6 | |
| 0.21 | 0.08 | 0.13 | |
| 0.56 | 0.11 | 0.45 | |
| 0.48 | 0.09 | 0.39 | |
| 0.44 | 0.02 | 0.42 | |
| 0.42 | 0.42 | 0 | |
| 0.26 | 0.23 | 0.03 | |
| 0.23 | 0.2 | 0.03 | |
| 0.46 | 0.4 | 0.06 | |
| 1.87 | 2.73 | -0.86 | |
| 0.5 | 0.02 | 0.48 | |
| 0.03 | 0.05 | -0.02 | |
| 0.03 | 0.02 | 0.01 | |
| 1.17 | 2.26 | -1.09 | |
| 11 | 0.58 | 10.42 | |
| 0.13 | 0.11 | 0.02 | |
| 0.12 | 0.24 | -0.12 | |
| 0.13 | 0.02 | 0.11 |
Analysis of Nitrogen:
| Nitrogen | Inflow | Outflow | Difference |
| sum | 19.24 | 8.21 | 11.03 |
| mean | 0.962 | 0.4105 | 0.5515 |
| t-test | 0.308727 | ||
| t-crit | 2.093 | Accept H0: no change | |
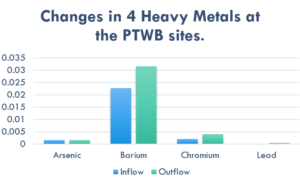
Heavy Metals: Data analysis of metals reported in both UTRP and PTWB locations
| Lead | ||||||||
| inflow | 0 | 0.0014 | 0.00131 | 0 | 0 | 0 | 0 | 0 |
| outflow | 0 | 0.000643 | 0 | 0 | 0.0008 | 0.000774 | 0 | 0 |
| difference | 0 | 0.000777 | 0.00131 | 0 | -0.0008 | -0.000774 | 0 | 0 |
| Arsenic | ||||||||
| Inflow | 0.00137 | 0 | 0.00151 | 0.000895 | 0.00171 | 0.00098 | 0.000517 | 0.00316 |
| Outflow | 0.000777 | 0 | 0.000686 | 0 | 0.00159 | 0.00133 | 0.00152 | 0.00213 |
| Difference | 0.000593 | 0 | 0.000824 | 0.000895 | 0.00012 | -0.00035 | -0.001 | 0.00103 |
| Barium | ||||||||
| Inflow | 0.0114 | 0.0136 | 0.0237 | 0.00811 | 0.0191 | 0.00996 | 0.00589 | 0.056 |
| Outflow | 0.0312 | 0.019 | 0.0371 | 0.0161 | 0.0274 | 0.0239 | 0.0255 | 0.0495 |
| Difference | -0.0198 | -0.0054 | -0.0134 | -0.00799 | -0.0083 | -0.01394 | -0.01961 | 0.0065 |
Analysis of heavy metals data:
| Lead | sum | mean | t-test | t-crit |
| inflow | 0.00273 | 0.00034125 | 0.805643 | 2.365 |
| outflow | 0.002217 | 0.000277125 | ||
| difference | 0.000513 | 0.000064125 | ||
| Arsenic | sum | mean | t-test | t-crit |
| Inflow | 0.010142 | 0.00126775 | 0.325361 | 2.365 |
| Outflow | 0.008033 | 0.001004125 | ||
| Difference | 0.002109 | 0.000263625 | ||
| Barium | sum | mean | t-test | t-crit |
| Inflow | 0.14776 | 0.01847 | 0.011817 | 2.365 |
| Outflow | 0.2297 | 0.0287125 | ||
| Difference | -0.08194 | -0.0102425 |
Documents
QAPP_Initiating Water Quality Testing Stormwater Treatment Wetlands CMP 1-043-000-B077
![]()


THIS PROJECT IS FUNDED BY A TEXAS COASTAL MANAGEMENT PROGRAM GRANT APPROVED BY THE TEXAS LAND COMMISSIONER PURSUANT TO NATIONAL OCEANIC AND ATMOSPHERIC ADMINISTRATION AWARD NO. NA18NOS4190153.
